Fig. 3
Download original image
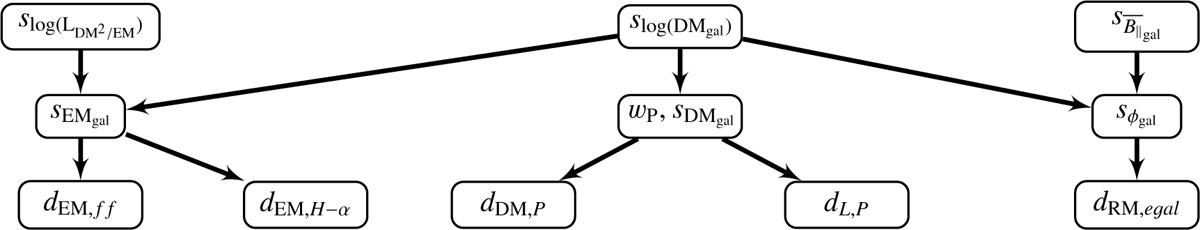
Graph illustrating the hierarchical Bayesian model employed in this work. The sky models in the upper layer correspond to the Gaussian fields, ψ,ρ, and χ, in that order. This graph omits several layers at the top, which are similar for each Gaussian field and contain the correlation structure modeling. For details on those, see Appendix A and Arras et al. (2022).
Current usage metrics show cumulative count of Article Views (full-text article views including HTML views, PDF and ePub downloads, according to the available data) and Abstracts Views on Vision4Press platform.
Data correspond to usage on the plateform after 2015. The current usage metrics is available 48-96 hours after online publication and is updated daily on week days.
Initial download of the metrics may take a while.