Fig. 7
Download original image
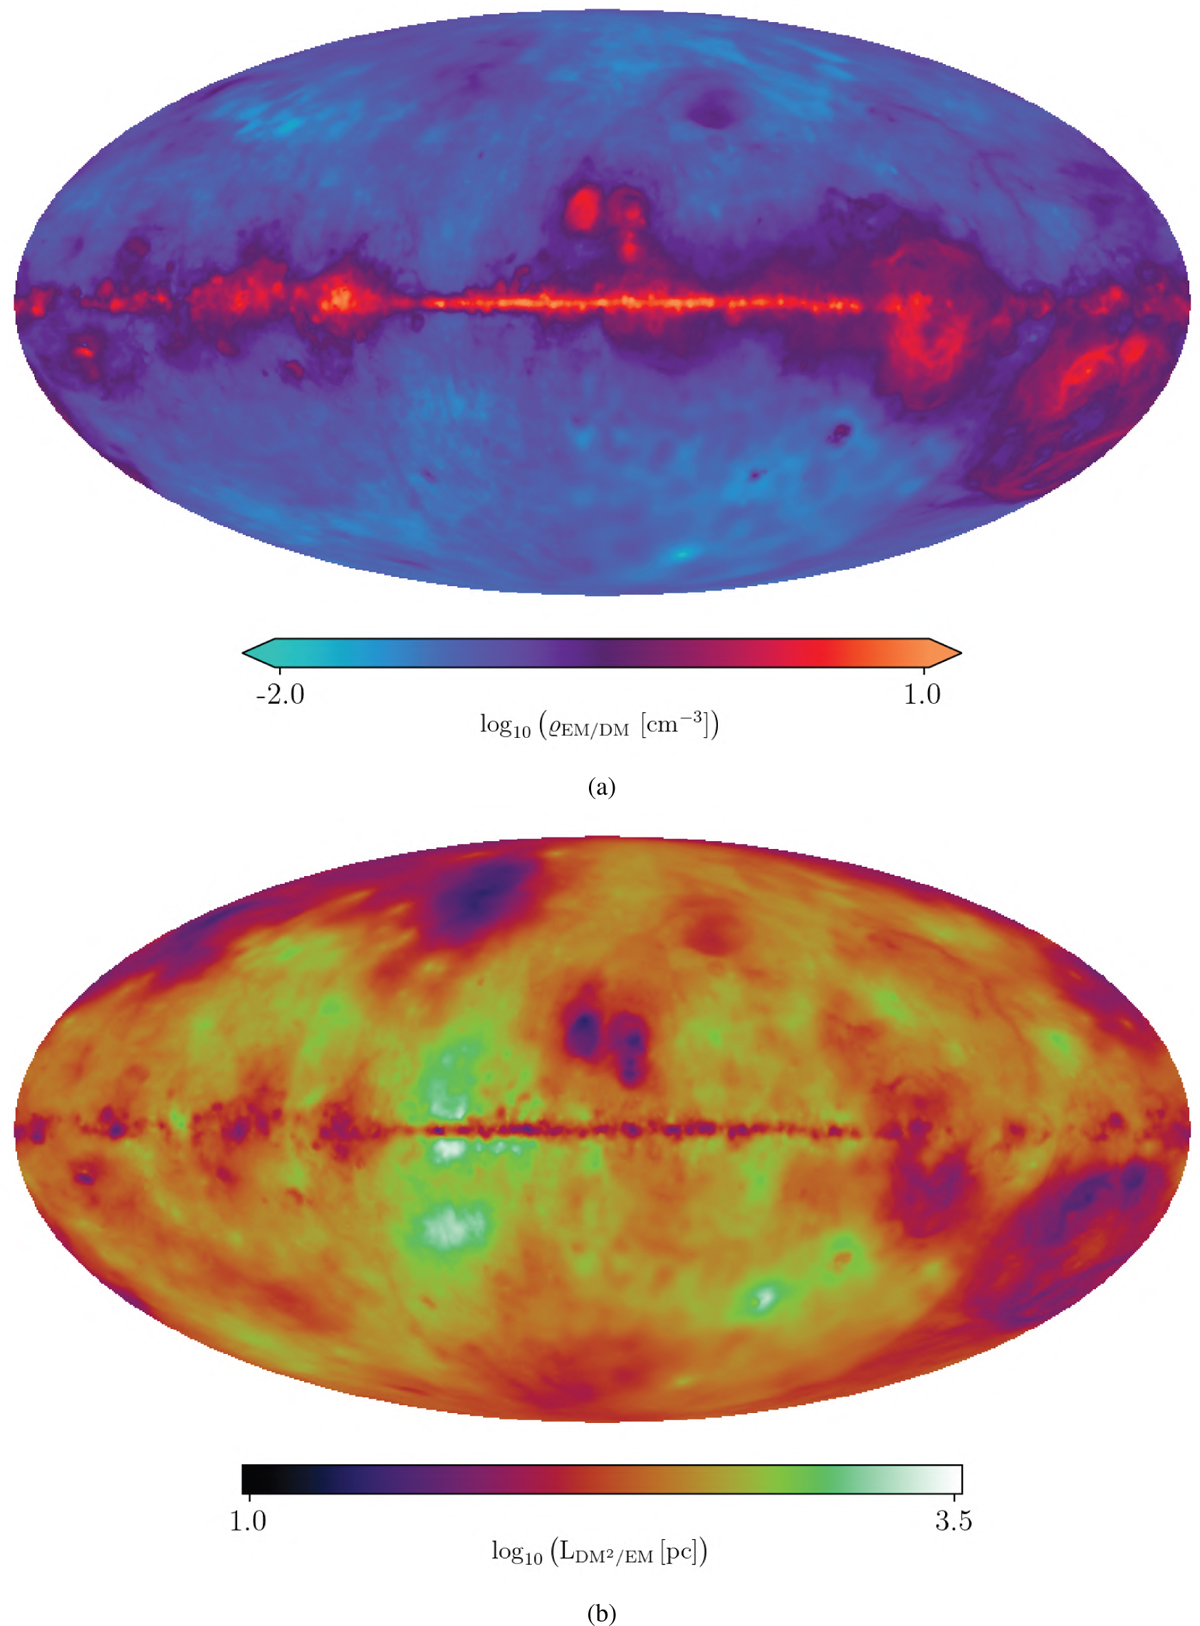
Inference results for the logarithmic ϱEM/DM (panel a) and ![]() (Fig. b)) skies. Both quantities highlight different aspects of the ionized ISM (see Eqs. (11) and (12) for their definitions and Sect. 2.3.1 for the accompanying discussion). The
(Fig. b)) skies. Both quantities highlight different aspects of the ionized ISM (see Eqs. (11) and (12) for their definitions and Sect. 2.3.1 for the accompanying discussion). The ![]() sky map is directly modeled in our work, while the ϱEM/DM map was calculated in a post-processing step.
sky map is directly modeled in our work, while the ϱEM/DM map was calculated in a post-processing step.
Current usage metrics show cumulative count of Article Views (full-text article views including HTML views, PDF and ePub downloads, according to the available data) and Abstracts Views on Vision4Press platform.
Data correspond to usage on the plateform after 2015. The current usage metrics is available 48-96 hours after online publication and is updated daily on week days.
Initial download of the metrics may take a while.