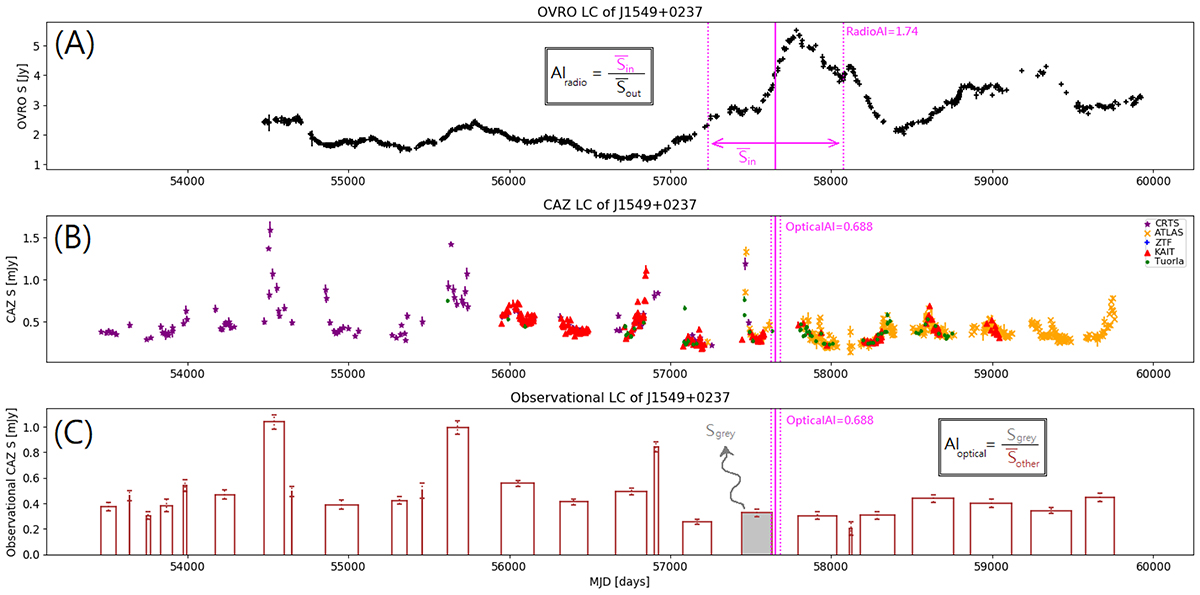
Fig. 2.
Download original image
Radio and optical light curves of the blazar J1549+0237 with a spatially associated neutrino, IC160924A. Top panel (A) shows the radio (OVRO) light curve. Middle panel (B) shows the optical (CAZ) light curve. Bottom panel (C) shows the optical (CAZ) light curve when converted into observational blocks (see Sect. 3.1.2). The solid vertical (magenta) line shows the moment of neutrino arrival. In case of radio, the time window for AI calculation is 2.3 years (see Sect. 3), shown by dotted vertical lines. In optical, the observational block used for AI calculation is within ±30 days of the neutrino arrival (see gray shading). For this association, the AI values in radio and optical are 1.74 and 0.688, respectively.
Current usage metrics show cumulative count of Article Views (full-text article views including HTML views, PDF and ePub downloads, according to the available data) and Abstracts Views on Vision4Press platform.
Data correspond to usage on the plateform after 2015. The current usage metrics is available 48-96 hours after online publication and is updated daily on week days.
Initial download of the metrics may take a while.