Fig. 3.
Download original image
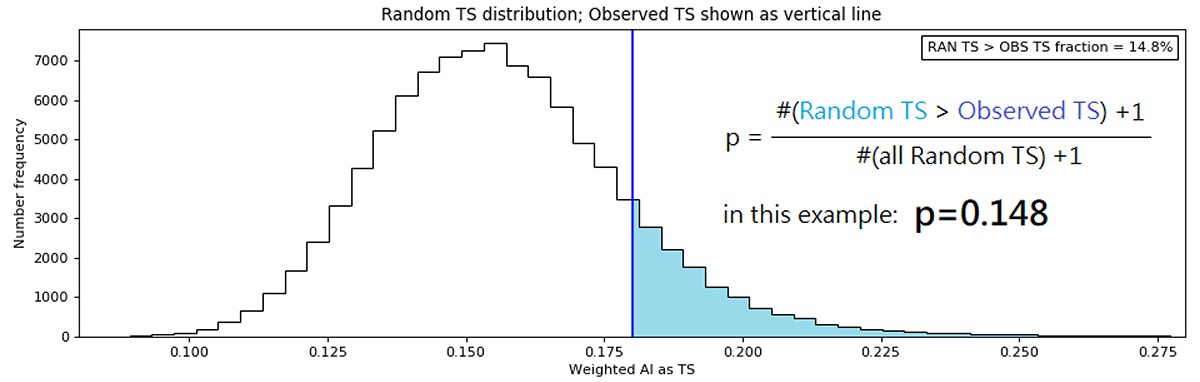
Distribution of the TS values for 105 random realizations shown in black, along with the observed TS value shown as a blue vertical line. In this example, the TS parameter used is AI on the CGRaBS observational optical light curves (see Sect. 3.1.2). The cyan region of the distribution is where random TS values are greater than the observed TS value, whose fraction gives the p-value to reject the null hypothesis (see Equation 1).
Current usage metrics show cumulative count of Article Views (full-text article views including HTML views, PDF and ePub downloads, according to the available data) and Abstracts Views on Vision4Press platform.
Data correspond to usage on the plateform after 2015. The current usage metrics is available 48-96 hours after online publication and is updated daily on week days.
Initial download of the metrics may take a while.