Fig. 4.
Download original image
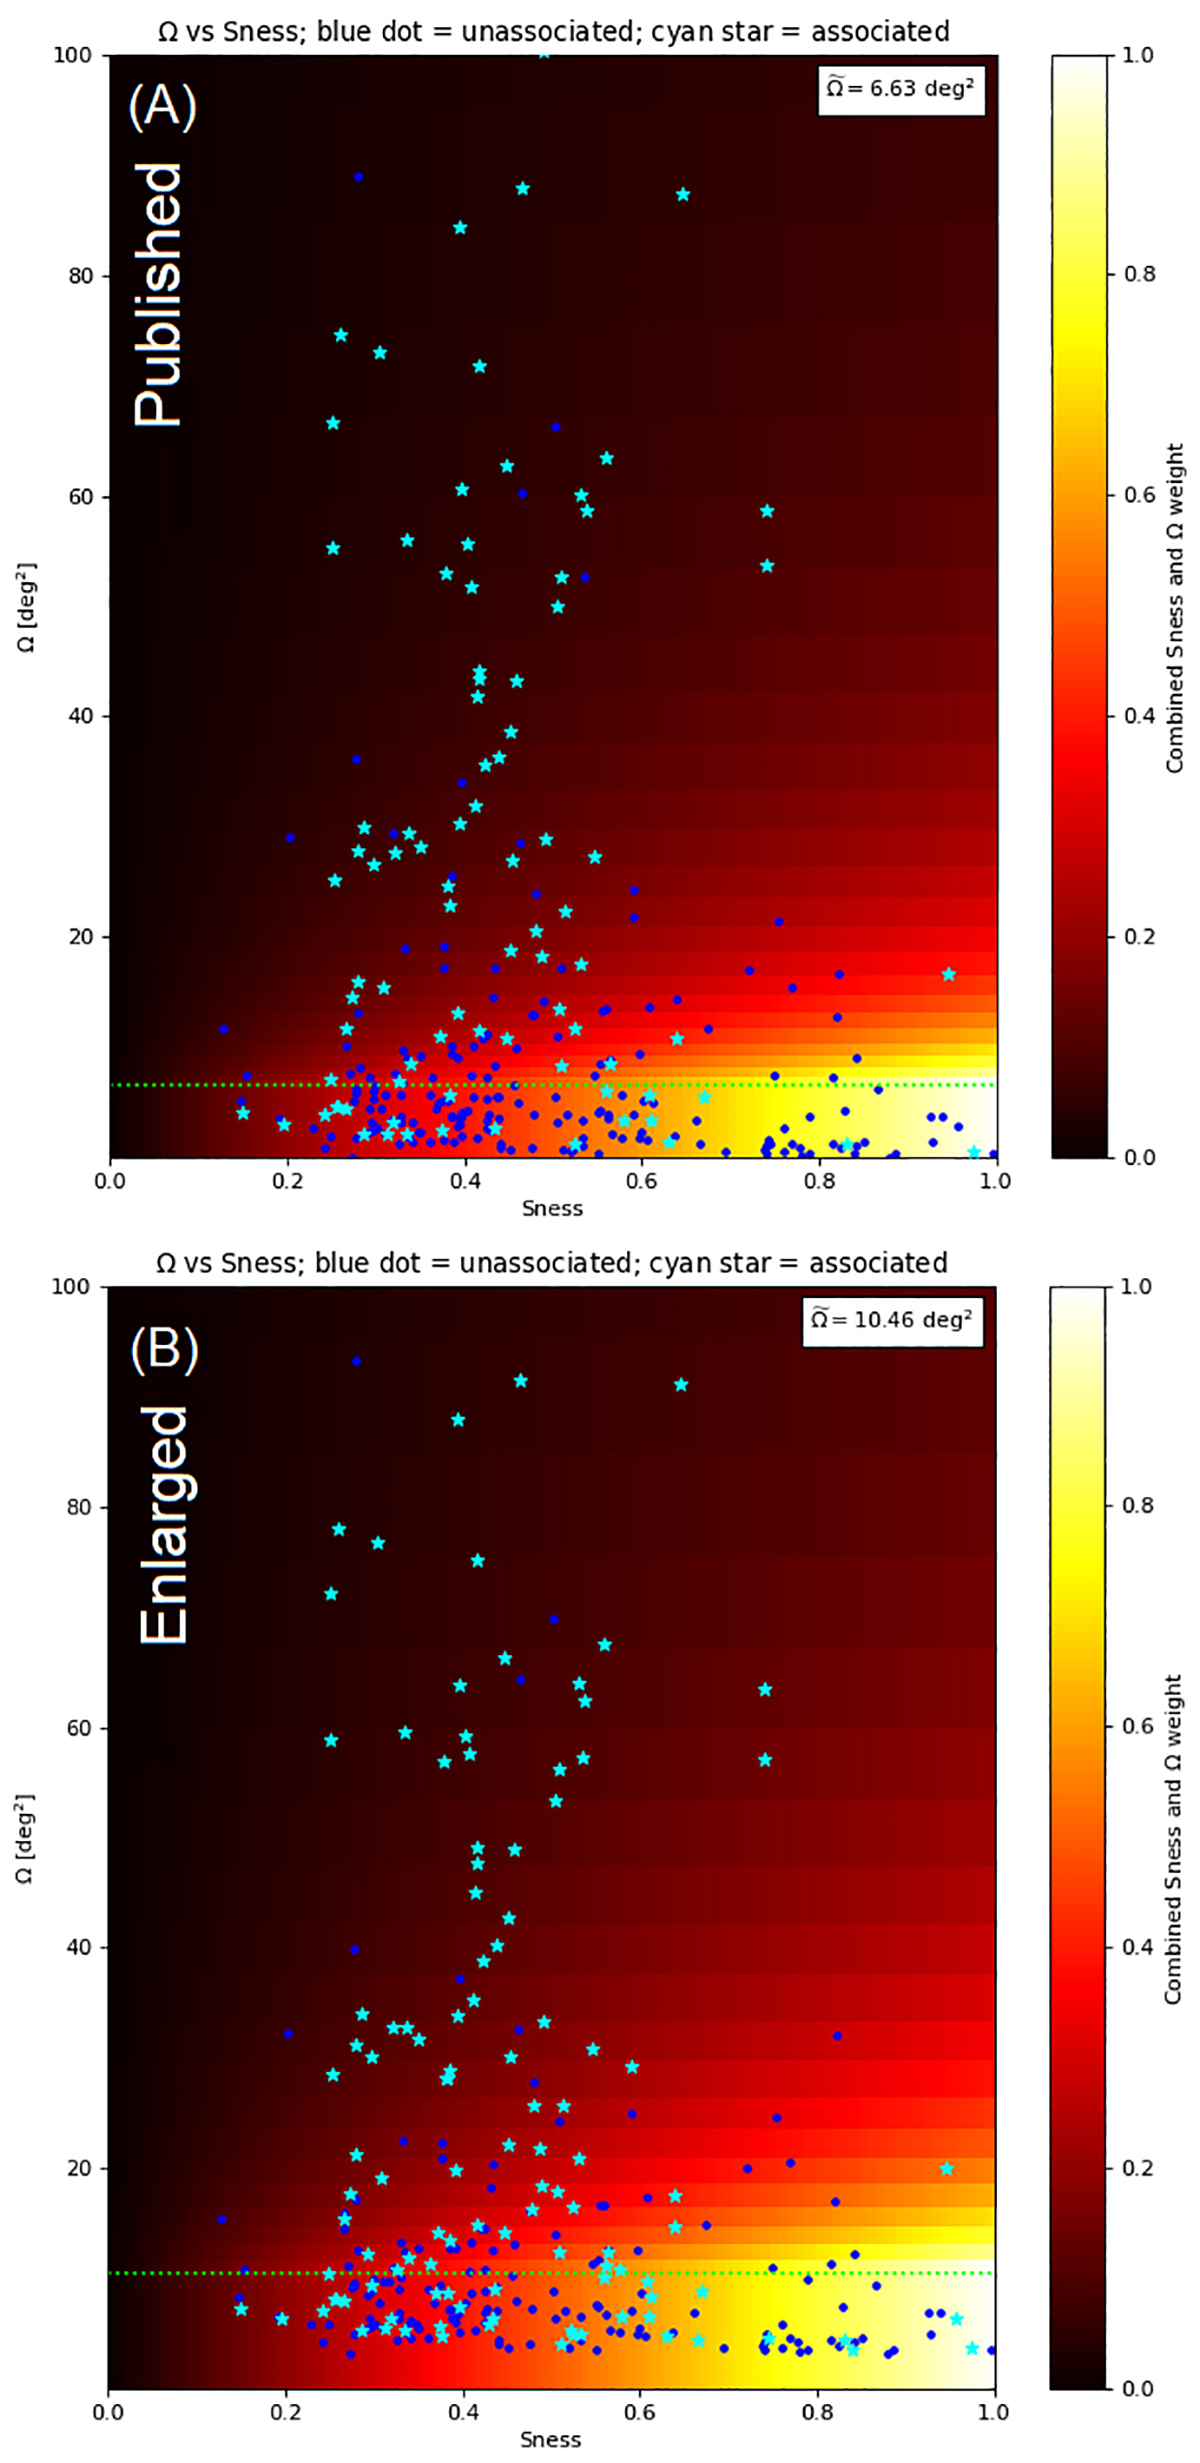
Distribution of the IceCat1+ neutrino events in terms of the error region size (Ω) and signalness (𝒮) shown for: (A) the published and (B) the enlarged error region scenarios (see Sect. 3.3). The neutrino events that have at least one blazar association are shown as cyan stars while those that have no blazar association are shown as blue dots. The horizontal dotted line shows ![]() (median Ω of IceCat1+). The weight as calculated by Equation 3 is shown as a heat-map ranging from 0 to 1. Note that in these plots 13 neutrinos with Ω > 100 deg2 are not shown.
(median Ω of IceCat1+). The weight as calculated by Equation 3 is shown as a heat-map ranging from 0 to 1. Note that in these plots 13 neutrinos with Ω > 100 deg2 are not shown.
Current usage metrics show cumulative count of Article Views (full-text article views including HTML views, PDF and ePub downloads, according to the available data) and Abstracts Views on Vision4Press platform.
Data correspond to usage on the plateform after 2015. The current usage metrics is available 48-96 hours after online publication and is updated daily on week days.
Initial download of the metrics may take a while.