Fig. 5.
Download original image
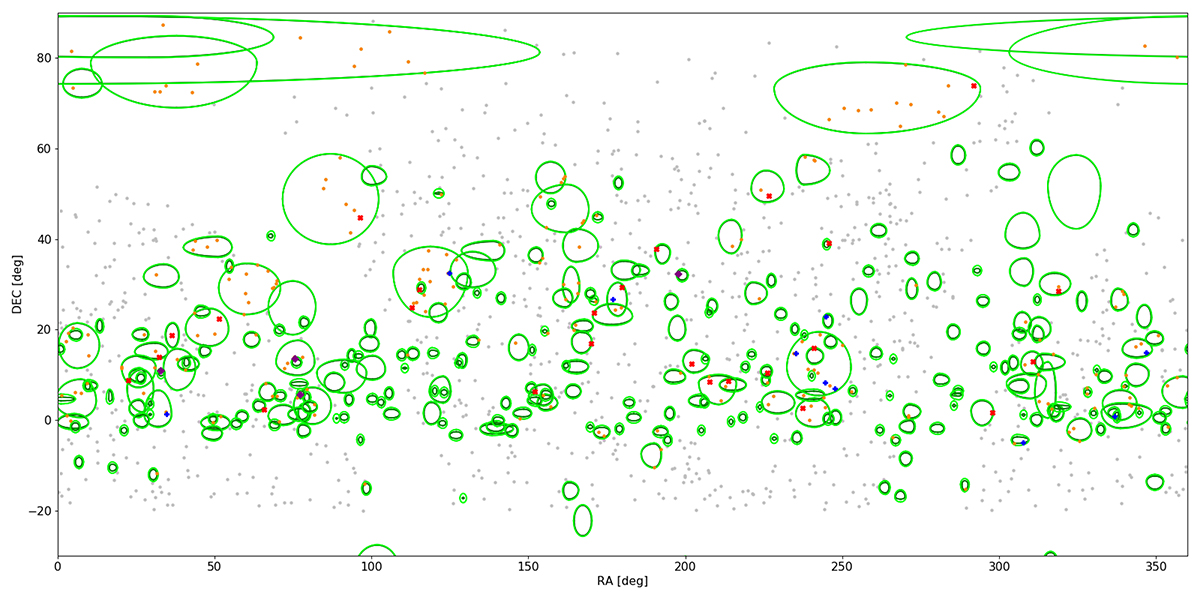
Sky distribution of 277 IceCat1+ neutrinos (six are below −30° Dec) and 1157 CGRaBS blazars. This plot is similar to Figure 1 with the exception that the published (dark green) and enlarged (light green) error regions are shown; note that by construction (see Sect. 3.3) the larger the event region size, the smaller the relative difference between the published and enlarged error regions. When considering the enlarged error region scenario, there are 242 blazars with at least one flaring association. The gray dots (915) show unassociated blazars while the orange dots (203) show spatially associated blazars which have no flaring association. The red crosses (25) are blazars with at least one flaring association in radio and the blue plus symbols (10) are those with at least one flaring association in optical. The ones that show at least one simultaneous radio+optical flare are shown as purple diamonds (4: J0502+1338–IC151114A, J0211+1051–IC131014A, J1310+3220–IC120515A, and J0509+0541–IC190317A, where the last one is the second neutrino association with TXS 0506+056 which was not as spatially accurate as the one in 2017).
Current usage metrics show cumulative count of Article Views (full-text article views including HTML views, PDF and ePub downloads, according to the available data) and Abstracts Views on Vision4Press platform.
Data correspond to usage on the plateform after 2015. The current usage metrics is available 48-96 hours after online publication and is updated daily on week days.
Initial download of the metrics may take a while.