Fig. 8.
Download original image
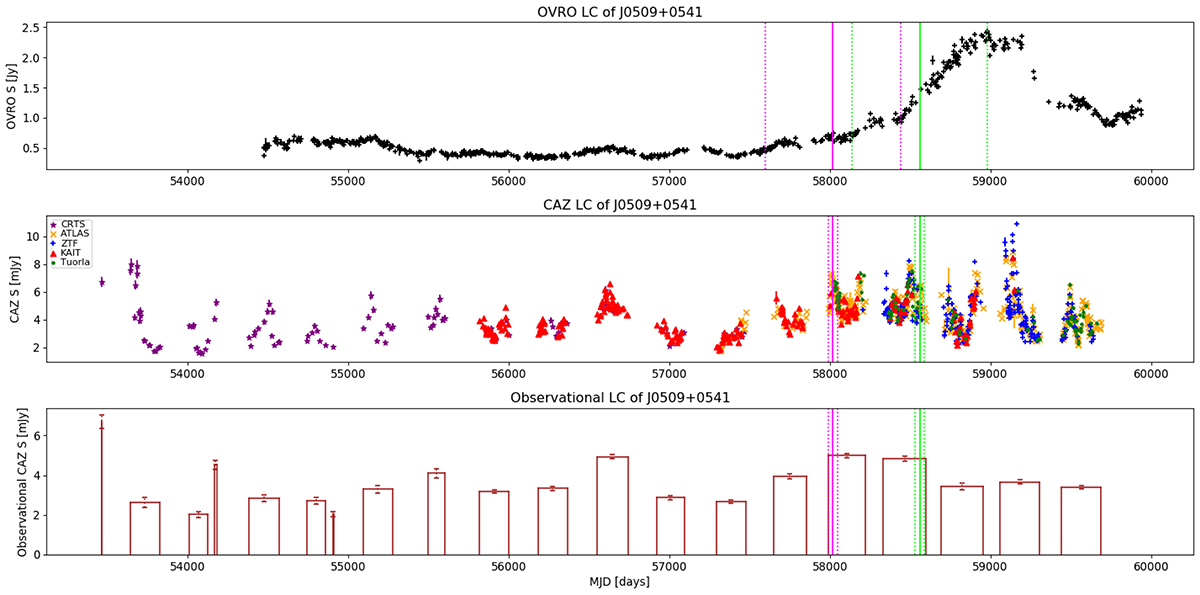
OVRO (radio), CAZ (optical), and observational CAZ light curves of the famous blazar J0509+0541 (alias: 5BZB J0509+0541, 4FGL J0509.4+0542, TXS 0506+056) given from top to bottom, respectively. The horizontal axis gives time in Modified Julian Date (MJD) and the vertical axis gives flux density (given in Jy in case of radio and mJy in case of optical). The vertical lines show the arrival time of spatially associated neutrinos, IC170922A (pink) and IC190317A (green). The dotted vertical lines show the AI time window centered around the neutrino arrival time. The former event is a spatially accurate one with Ωenlarged = 4.93 deg2 and 𝒮 = 0.631 which lead to the most famous individually associated blazar-neutrino spatio-temporal connection to-date (IceCube Collaboration 2018); in our study this is also a very prominent flaring association but only in the optical band (see Sect. 4.2.5). The latter neutrino event has notably less accurate spatial resolution with Ωenlarged = 77.96 deg2 and 𝒮 = 0.26, which leads to the weakest (after weighting) of the four radio+optical flaring associations. Note that both of these associations occur in both the published and enlarged error region scenarios.
Current usage metrics show cumulative count of Article Views (full-text article views including HTML views, PDF and ePub downloads, according to the available data) and Abstracts Views on Vision4Press platform.
Data correspond to usage on the plateform after 2015. The current usage metrics is available 48-96 hours after online publication and is updated daily on week days.
Initial download of the metrics may take a while.