Fig. D.1.
Download original image
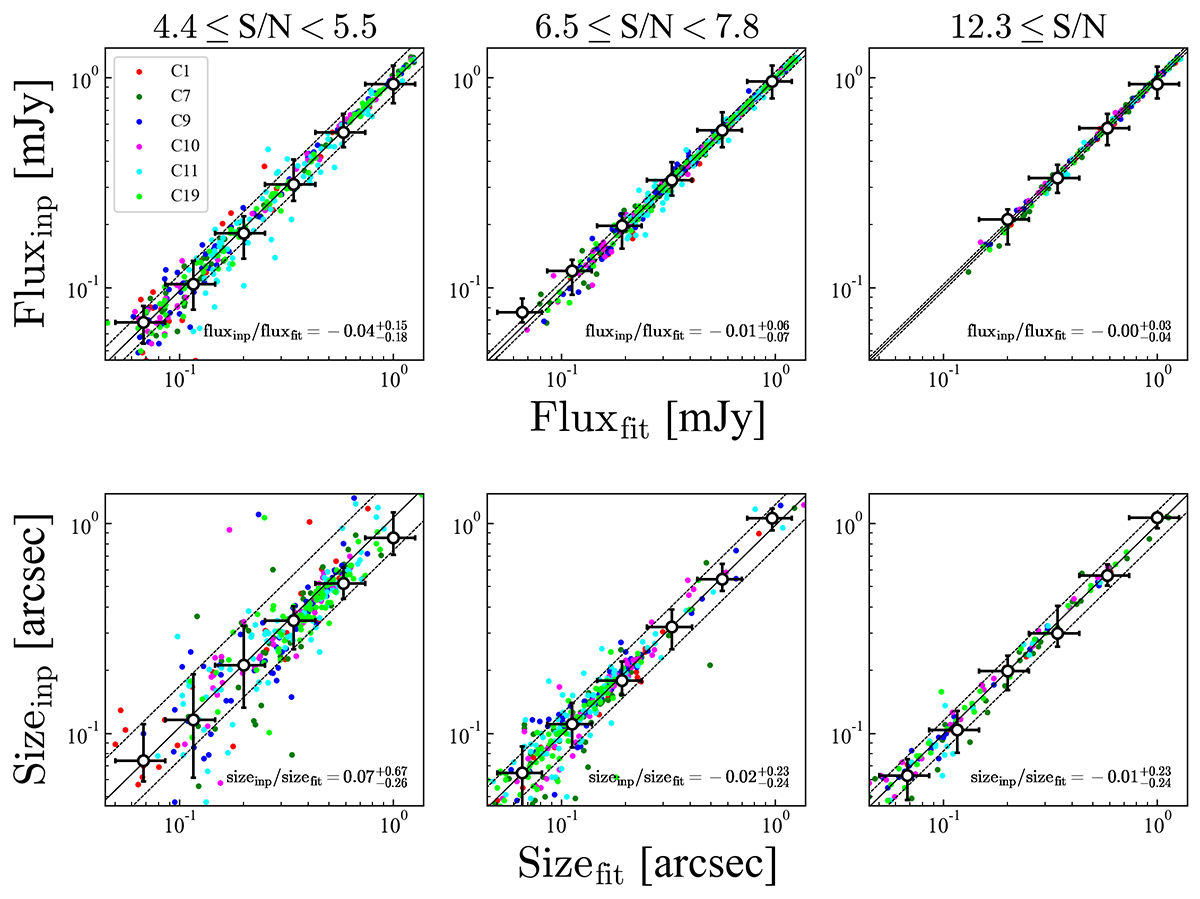
Comparison of the flux density and FWHM between fitting results and input models. The left, middle, and right panels show the results for sources detected at S/N = 4.4–5.5, S/N = 6.5–7.8 and S/N ≥ 12.3, respectively. Different colors indicate different visibilities used in the simulation, corresponding to the different array configurations. White circles and error bars show 50 ± 34% percentiles in the bins of output values. Black solid and dashed lines correspond to the averages and standard deviations of the fitting results and output models, which are also shown in the bottom right of each panel.
Current usage metrics show cumulative count of Article Views (full-text article views including HTML views, PDF and ePub downloads, according to the available data) and Abstracts Views on Vision4Press platform.
Data correspond to usage on the plateform after 2015. The current usage metrics is available 48-96 hours after online publication and is updated daily on week days.
Initial download of the metrics may take a while.