Open Access
Fig. G.2.
Download original image
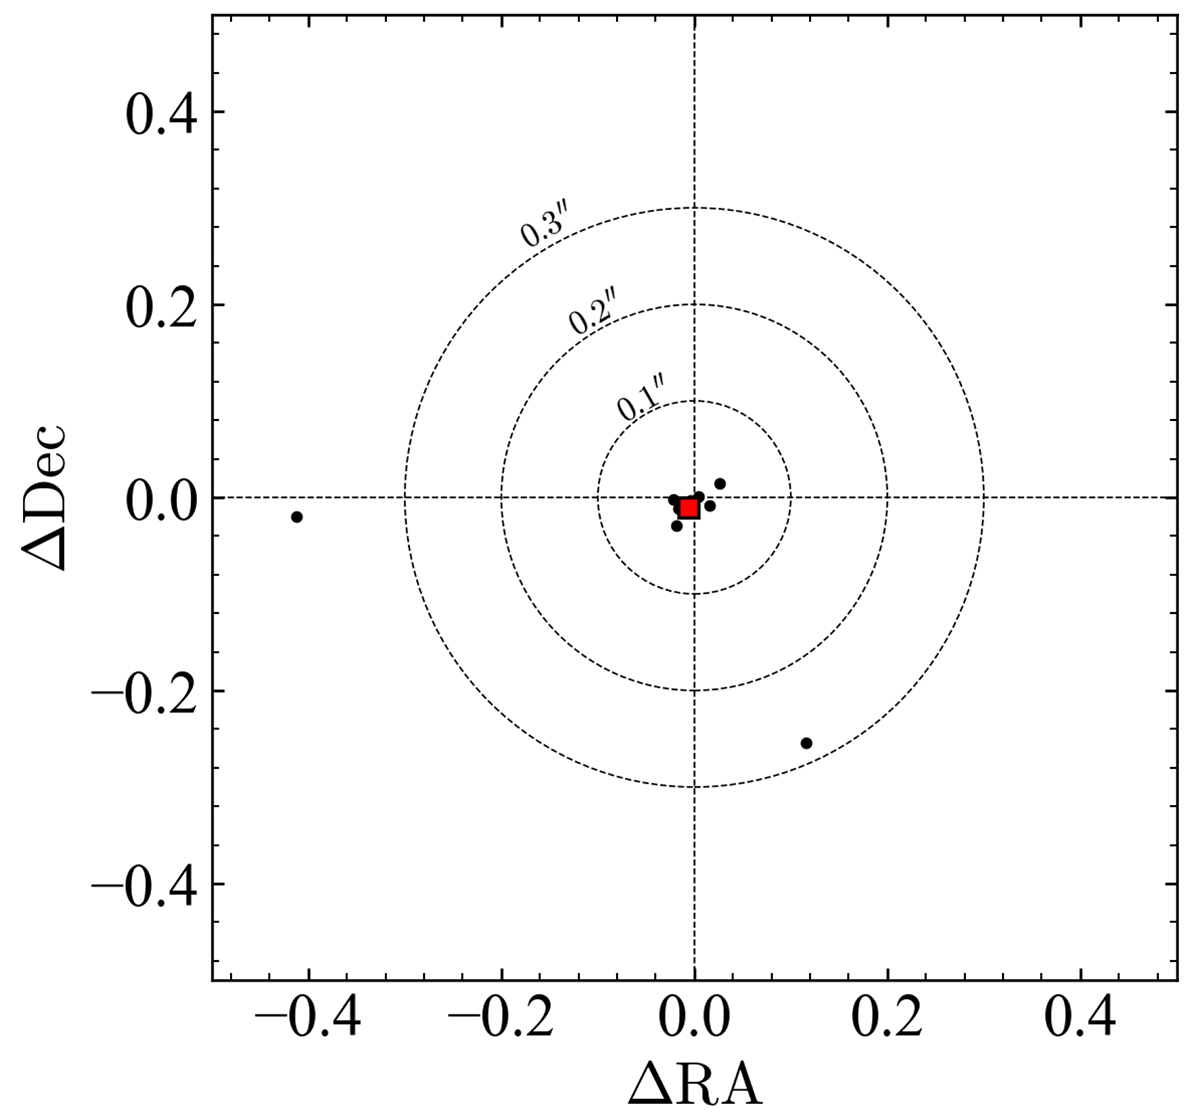
Coordinate offset between sources extracted in the HST image and those in Gaia DR1 data. Black and red points show the individual and median values, respectively. While the number of Gaia sources included in the HST images is small, there is no systematic offset in the HST images due to astrometry.
Current usage metrics show cumulative count of Article Views (full-text article views including HTML views, PDF and ePub downloads, according to the available data) and Abstracts Views on Vision4Press platform.
Data correspond to usage on the plateform after 2015. The current usage metrics is available 48-96 hours after online publication and is updated daily on week days.
Initial download of the metrics may take a while.