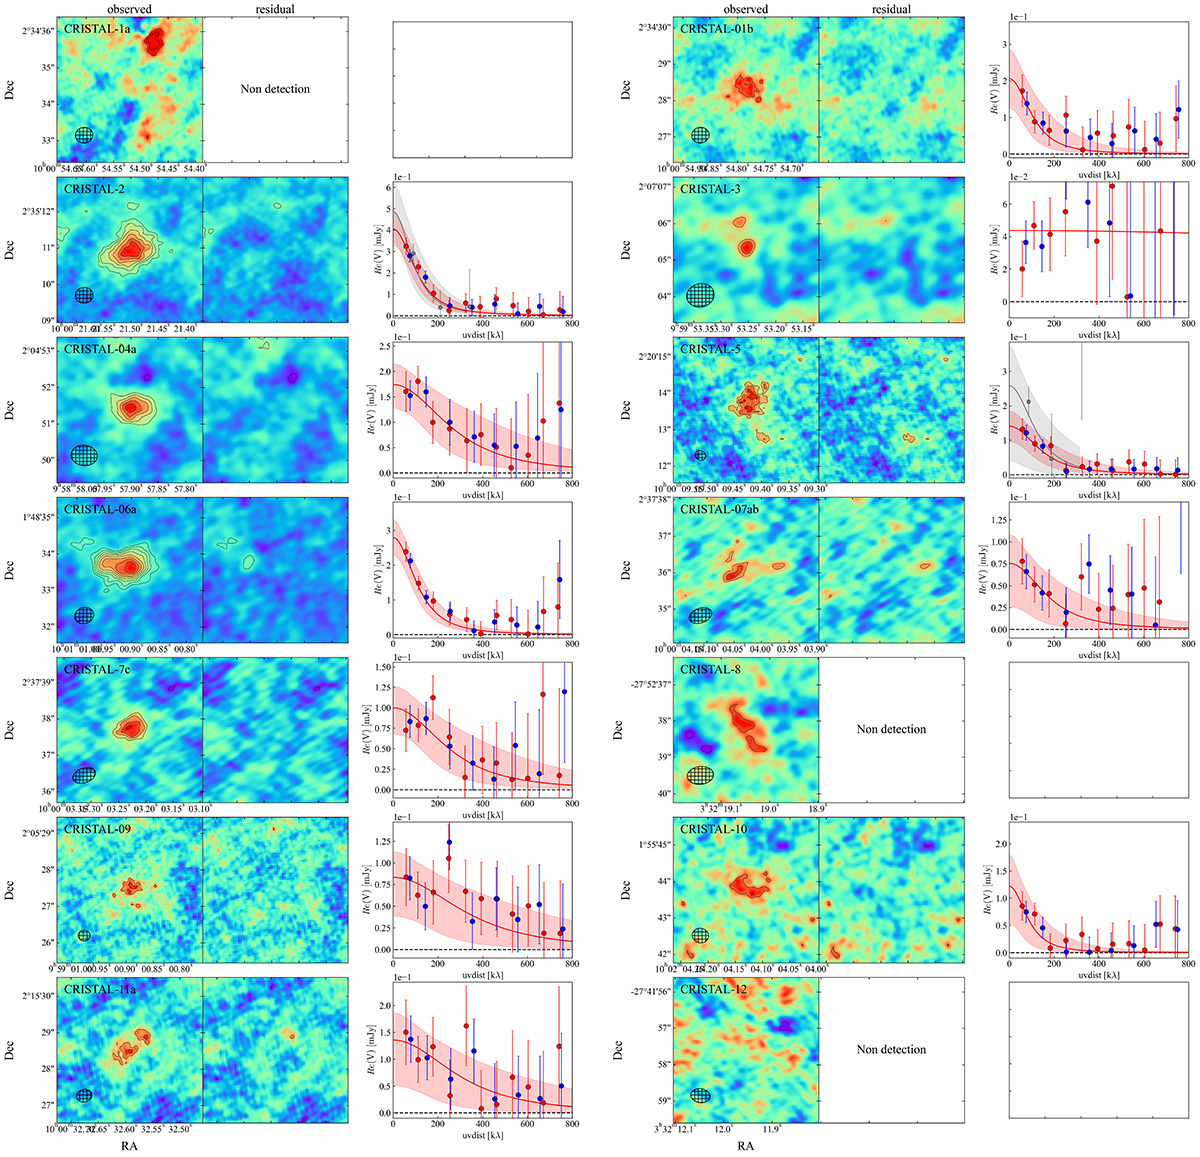
Fig. G.3.
Download original image
Fitting results of the ALMA images. The left and middle panels show the natural-weighted observed and residual images respectively. The contours indicate every 1σ from ±3σ to 10σ and every 3σ from 10σ. The right panels show the visibility real part as a function of uv-distance from a central position of the fitting in two different binning scales (red and blue). Red solid lines and shaded regions show best-fit models and 1σ uncertainties. We also show sizes without the CRISTAL dataset when the fittings have converged. (gray points and solid lines).
Current usage metrics show cumulative count of Article Views (full-text article views including HTML views, PDF and ePub downloads, according to the available data) and Abstracts Views on Vision4Press platform.
Data correspond to usage on the plateform after 2015. The current usage metrics is available 48-96 hours after online publication and is updated daily on week days.
Initial download of the metrics may take a while.