Fig. 6.
Download original image
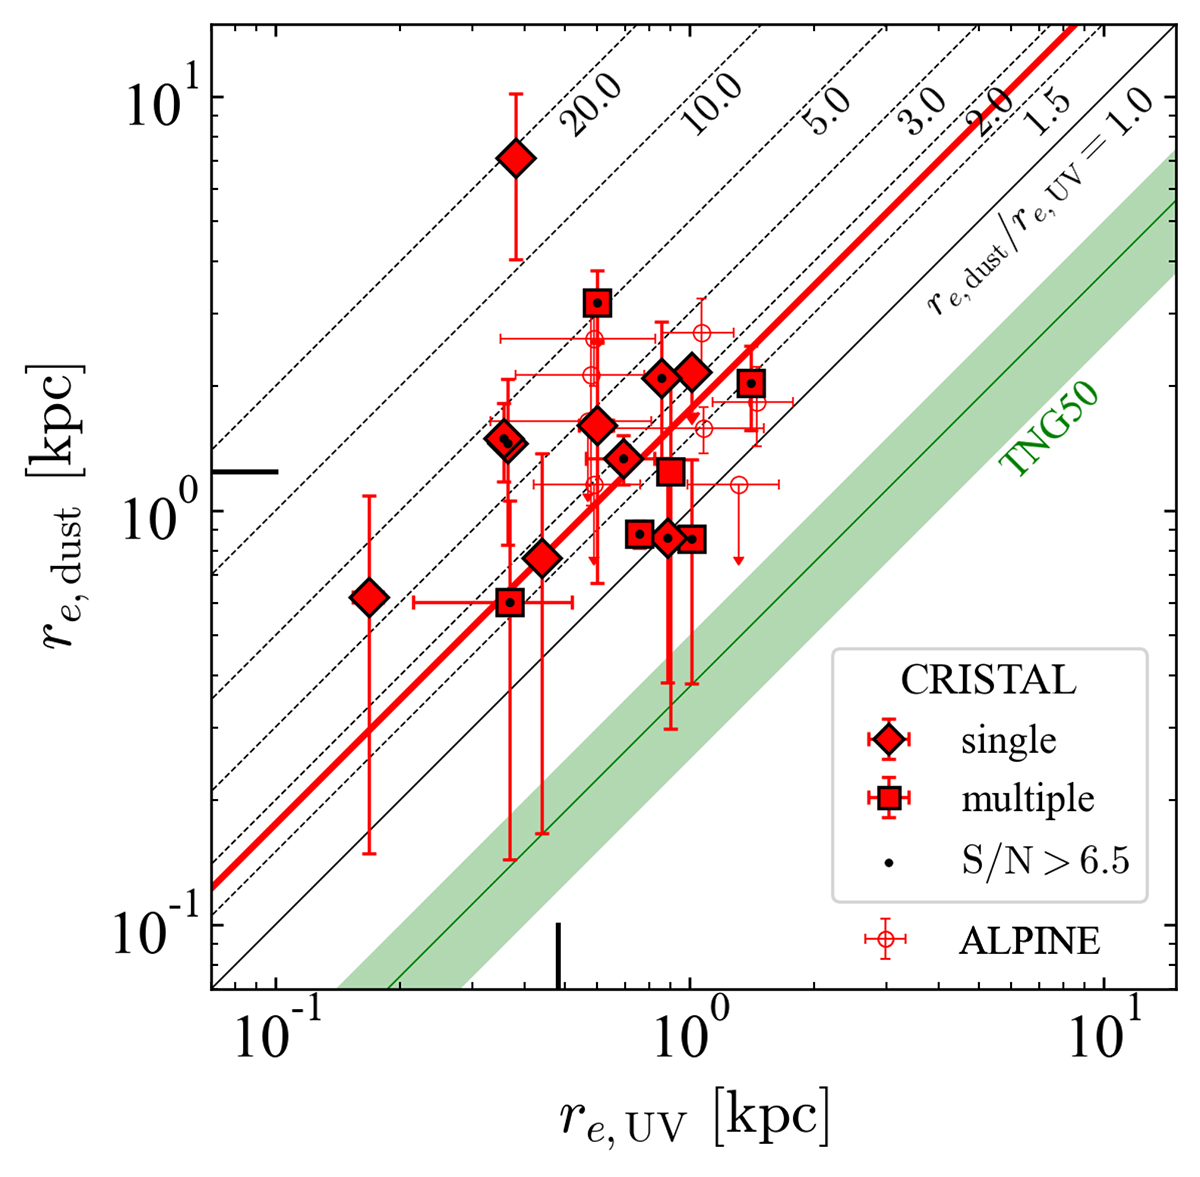
Size comparison of the dust continuum (re, dust) and the UV continuum (re, UV). The black solid and dashed lines indicate the size ratios of the UV and dust continuum. The average size ratio of the CRISTAL galaxies (re, dust/re, UV ∼ 1.8) is shown with the red solid line. Recent results from the ALPINE survey are also shown in red open circles (Pozzi et al. 2024). The black vertical and horizontal lines show representative beam sizes (σbeam) in HST (x-axis) and ALMA (y-axis). The green shaded region shows the size ratio predicted in the illustrious TNG50 simulation (Popping et al. 2022). Overall, CRISTAL galaxies possibly have a more extended distribution in dust thermal emission than in UV radiation, which is contrary to expectations based on simulation.
Current usage metrics show cumulative count of Article Views (full-text article views including HTML views, PDF and ePub downloads, according to the available data) and Abstracts Views on Vision4Press platform.
Data correspond to usage on the plateform after 2015. The current usage metrics is available 48-96 hours after online publication and is updated daily on week days.
Initial download of the metrics may take a while.