Fig. 3
Download original image
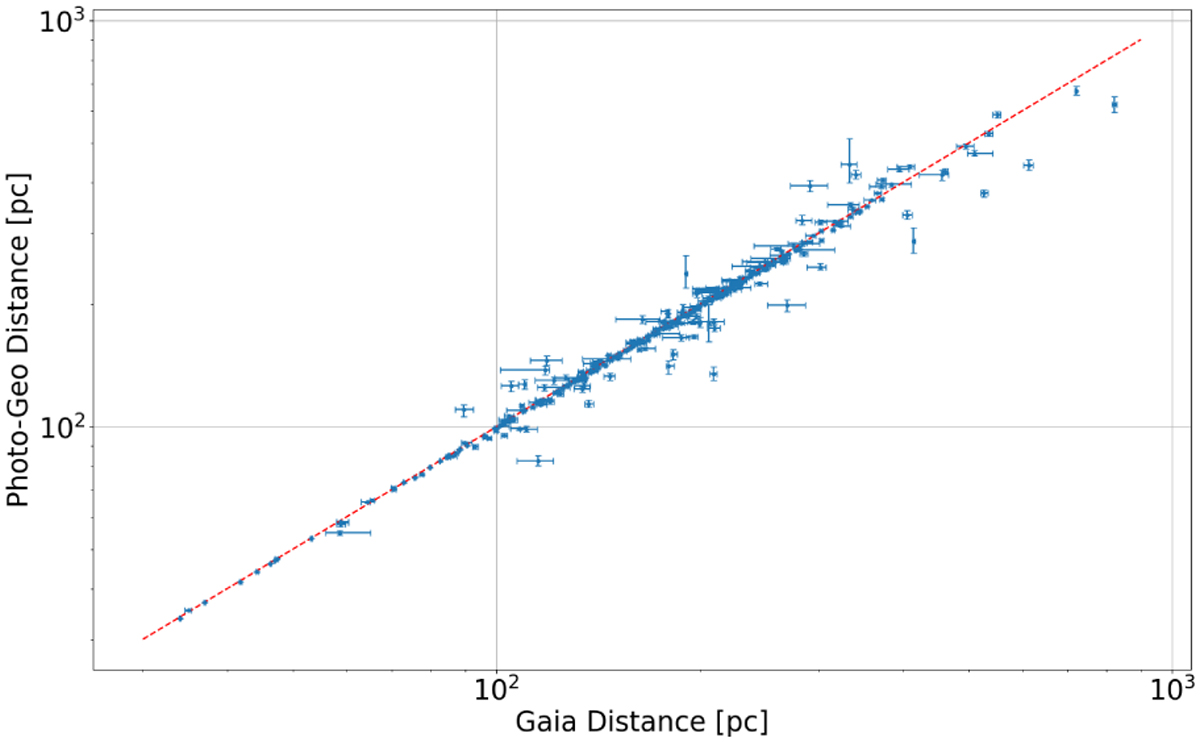
Comparison of the distance estimates in Gaia DR3 from the GSP-Phot module and probabilistic inference from Bailer-Jones et al. (2021). The graph is shown in logarithmic scale, with the 1:1 relation highlighted by the red dotted line. Overall there is a good agreement between both methods, suggesting the GSP-Phot values and luminosity derived from these should be sound.
Current usage metrics show cumulative count of Article Views (full-text article views including HTML views, PDF and ePub downloads, according to the available data) and Abstracts Views on Vision4Press platform.
Data correspond to usage on the plateform after 2015. The current usage metrics is available 48-96 hours after online publication and is updated daily on week days.
Initial download of the metrics may take a while.