Fig. 10.
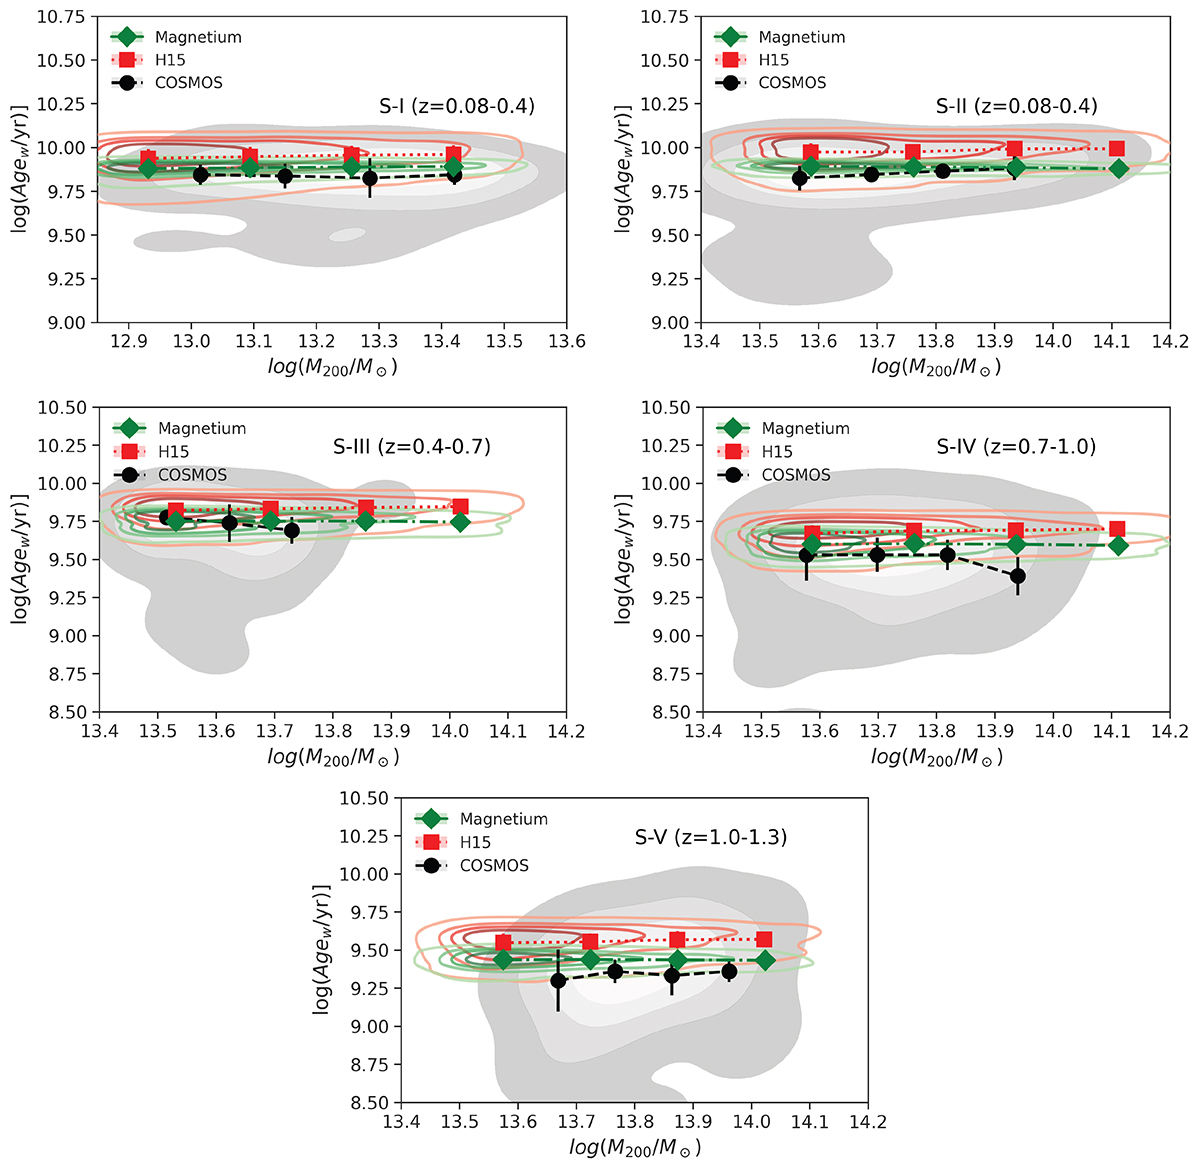
Download original image
log(Agew/yr) of the BGGs as a function of the halo mass of groups (log(M200/M⊙)) in the observations (shaded KDE density maps), Magneticum (green contours), and H15 SAM (red contours) for S-I to S-V subsamples. Black points, green diamonds, and red squares present the median stellar age at given halo masses in the observations, Magneticum and H15, respectively. The bottom-right panel illustrates the stellar age of BGGe versus group mass for the combined sample of BGGs in S-II to S-V. All trends indicate no noticeable relationship between the stellar age of BGGs and the halo mass of their host groups.
Current usage metrics show cumulative count of Article Views (full-text article views including HTML views, PDF and ePub downloads, according to the available data) and Abstracts Views on Vision4Press platform.
Data correspond to usage on the plateform after 2015. The current usage metrics is available 48-96 hours after online publication and is updated daily on week days.
Initial download of the metrics may take a while.