Fig. 20
Download original image
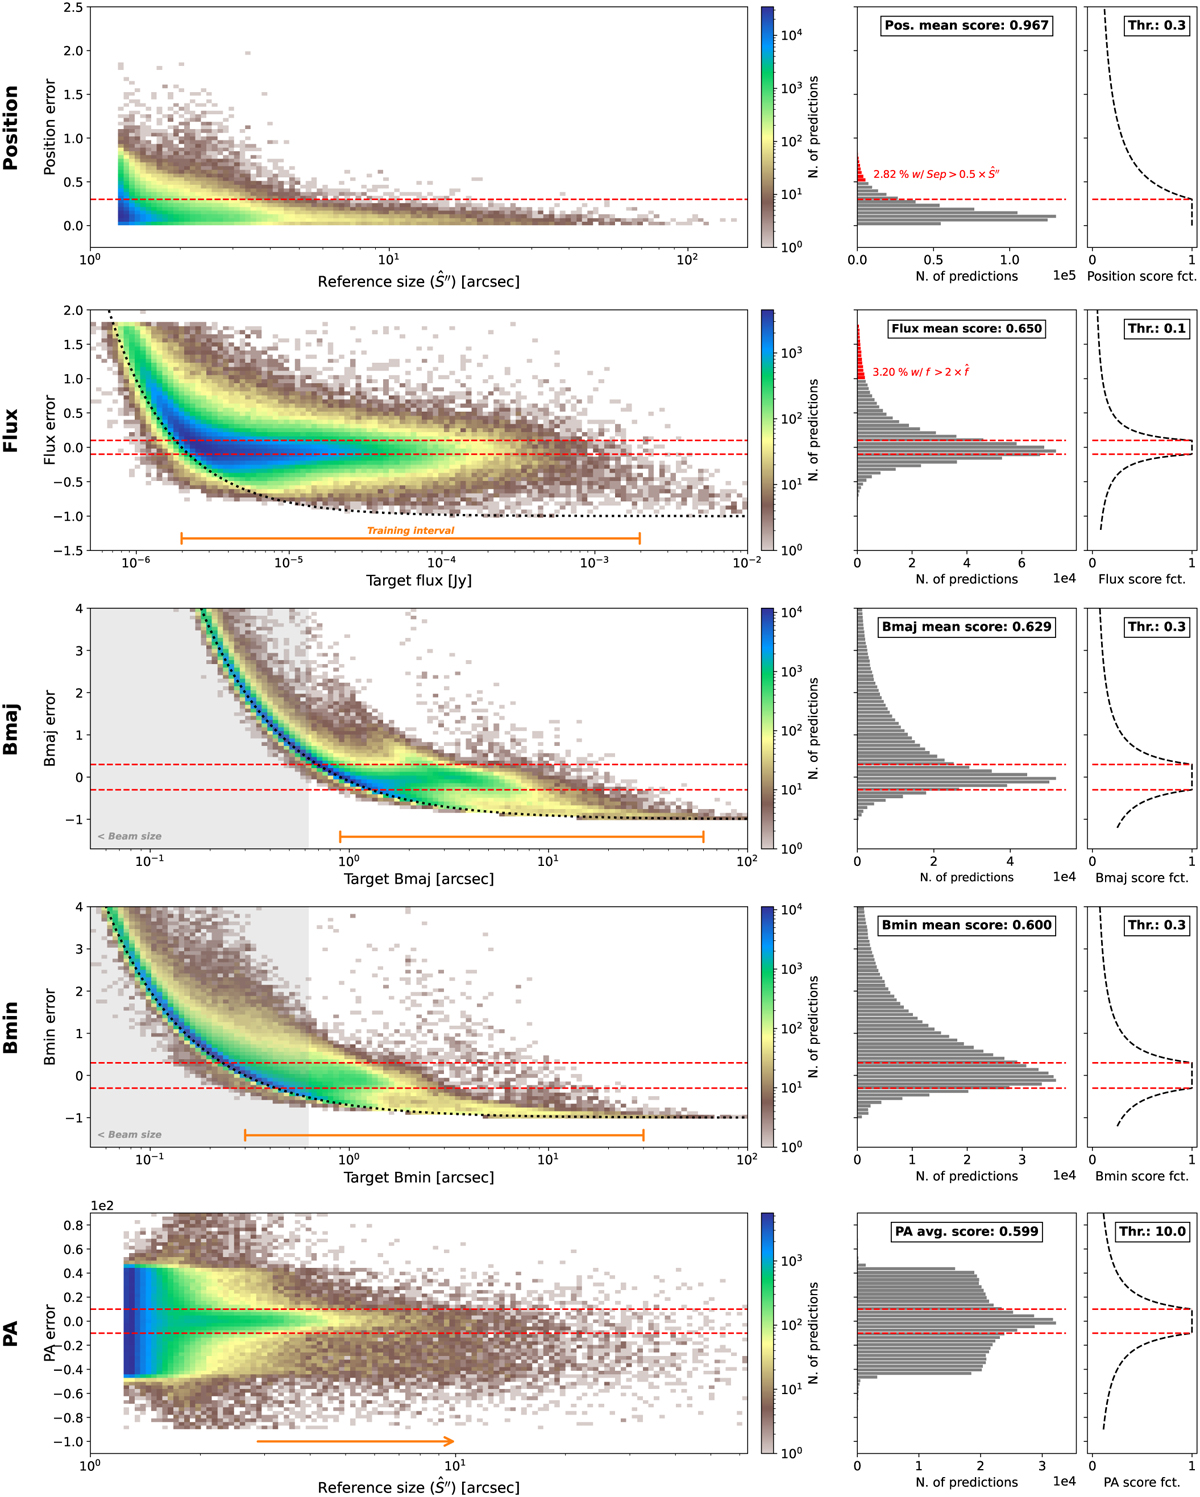
Two-dimensional histograms of the different parameter errors defined by the scorer as a function of relevant difficulty proxies. The left column represents the two-dimensional histograms. The right column represents a 1D histogram of the relative error projected over the same axis as the left column. To the right of this projection and using the same axis projection, we indicate the specific response of the score function for each parameter following Eq. (19) and Fig. 6. The red dashed line indicates the edges of the area for which the parameter score is saturated at its maximum value. The orange lines and arrow indicate the value range available in the training sample. The gray overlay represents the size regime for which the sources are smaller than the beam size.
Current usage metrics show cumulative count of Article Views (full-text article views including HTML views, PDF and ePub downloads, according to the available data) and Abstracts Views on Vision4Press platform.
Data correspond to usage on the plateform after 2015. The current usage metrics is available 48-96 hours after online publication and is updated daily on week days.
Initial download of the metrics may take a while.