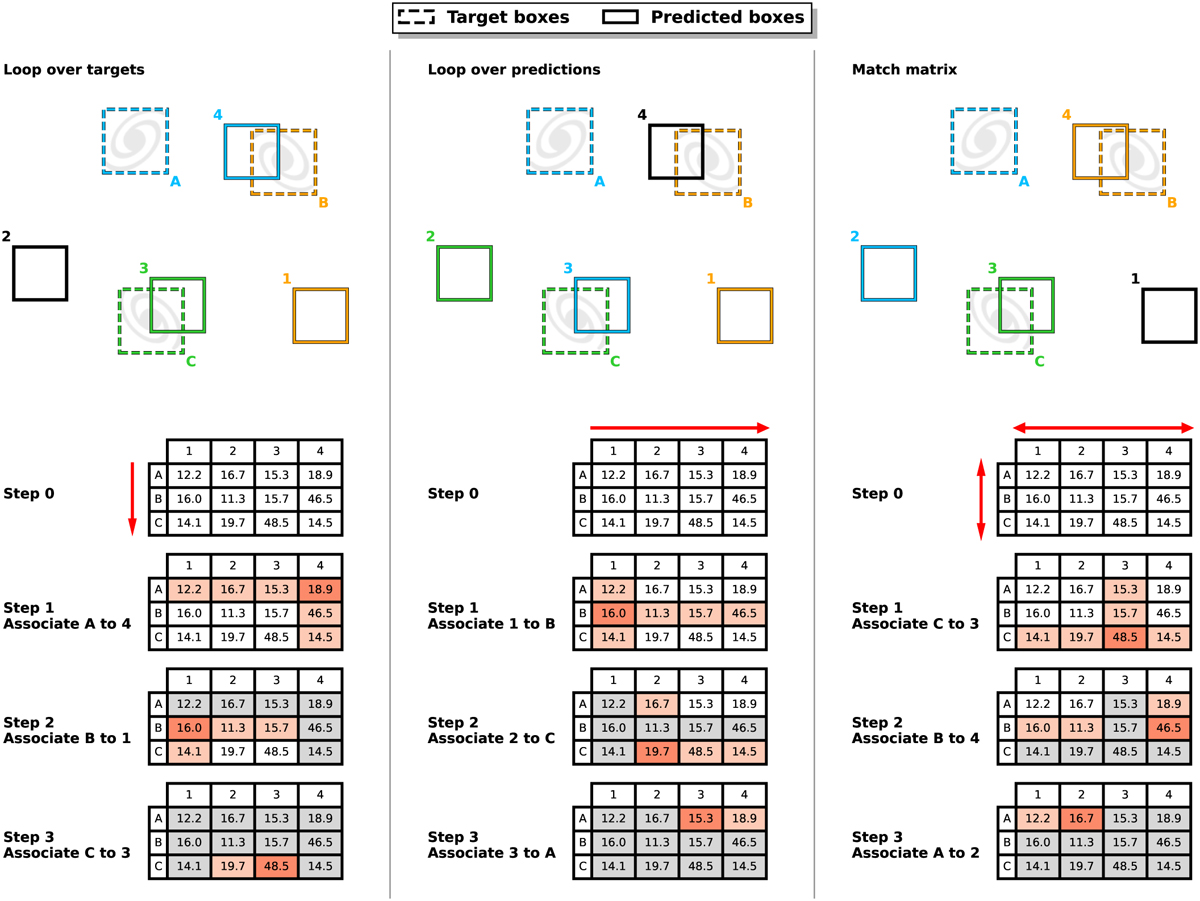
Fig. A.4
Download original image
Comparison of the target-prediction association in a grid cell regarding the search order. The color indicates which prediction was associated with each target. All predictions and targets have the same size and shape, respectively. The prediction-target pairs are compared using a scaled matching metric expressed as (DIoU + I)×0.5×100. The results for all pairs are displayed in a matching matrix. For each step of the association process, the rows and columns corresponding to the targets and predictions are highlighted in light red, with the intersection being the match score for this pair. For all subsequent steps, the now unavailable elements in the matrix are shown in gray. The three frames compare different association results, along with the corresponding association steps highlighted in the match score matrix, when looping over the targets (left), looping over the predictions (middle), or searching for the maximum value in the score matrix (right).
Current usage metrics show cumulative count of Article Views (full-text article views including HTML views, PDF and ePub downloads, according to the available data) and Abstracts Views on Vision4Press platform.
Data correspond to usage on the plateform after 2015. The current usage metrics is available 48-96 hours after online publication and is updated daily on week days.
Initial download of the metrics may take a while.