Fig. 11
Download original image
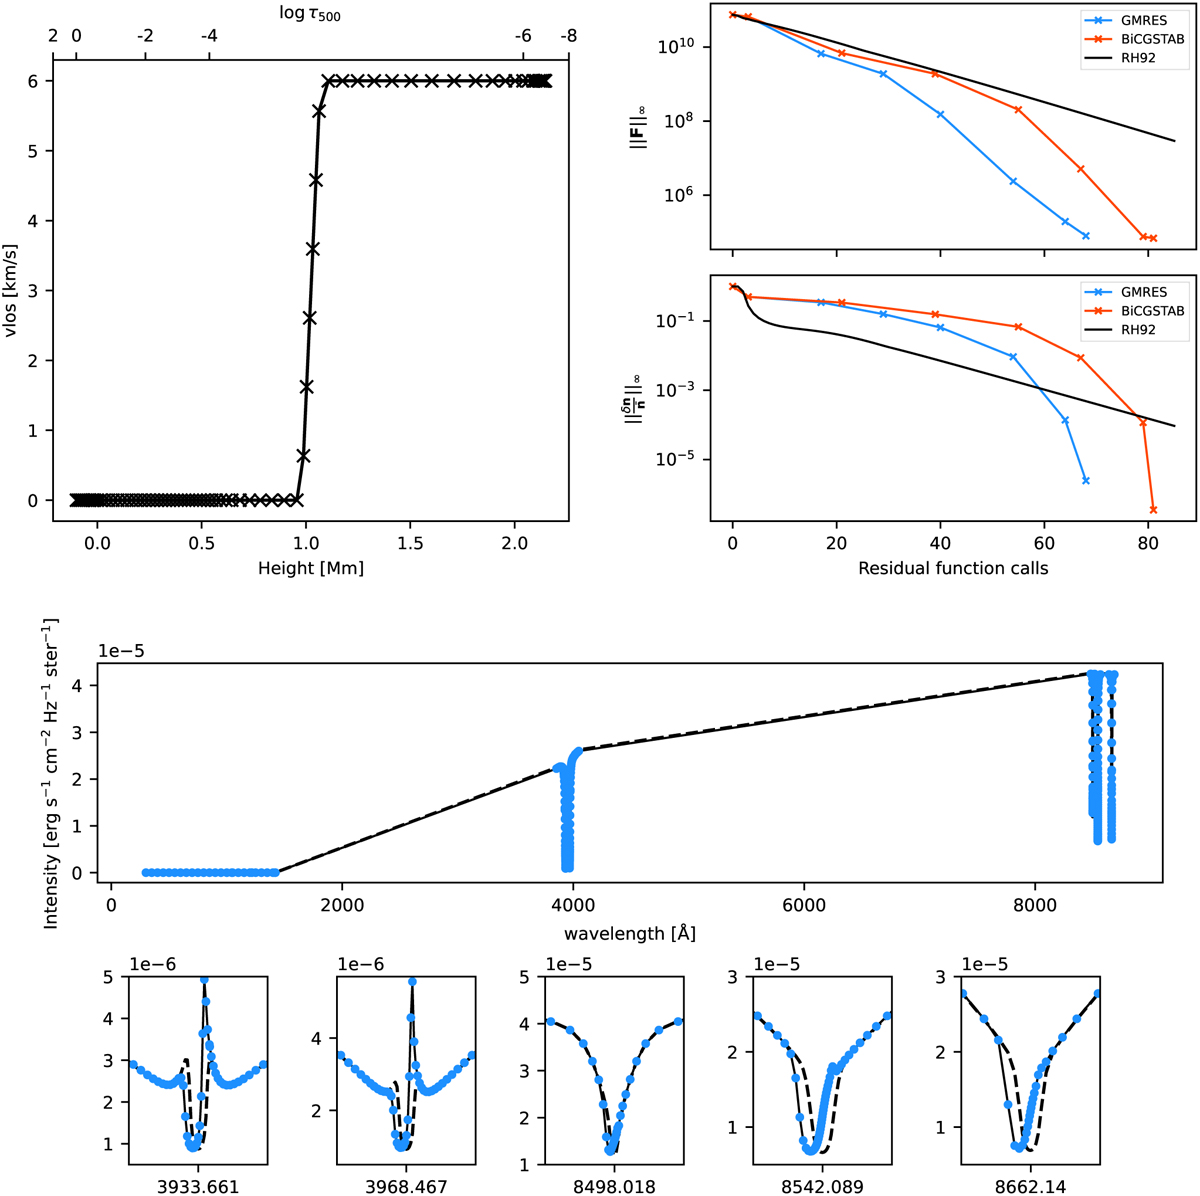
Velocity gradient convergence test for the different solvers. Top left panel: line-of-sight velocity profile used for the test. Top right panel: Associated convergence plot for the six-level Ca II setup with a Krylov relative tolerance of 10−2 and initial LTE population densities. All the solvers required more iterations to converge than in the case shown in Fig. 6. Bottom panel: converged spectrum including the velocity gradient for RH92 (black) and JFNK (GMRES) (blue). A JFNK (GMRES) velocity-free reference spectrum (dashed black) is also shown. A blueshift clearly occurs near the line center due to the positive velocity gradient at the base of the chromosphere, resulting in very asymmetric output lines.
Current usage metrics show cumulative count of Article Views (full-text article views including HTML views, PDF and ePub downloads, according to the available data) and Abstracts Views on Vision4Press platform.
Data correspond to usage on the plateform after 2015. The current usage metrics is available 48-96 hours after online publication and is updated daily on week days.
Initial download of the metrics may take a while.