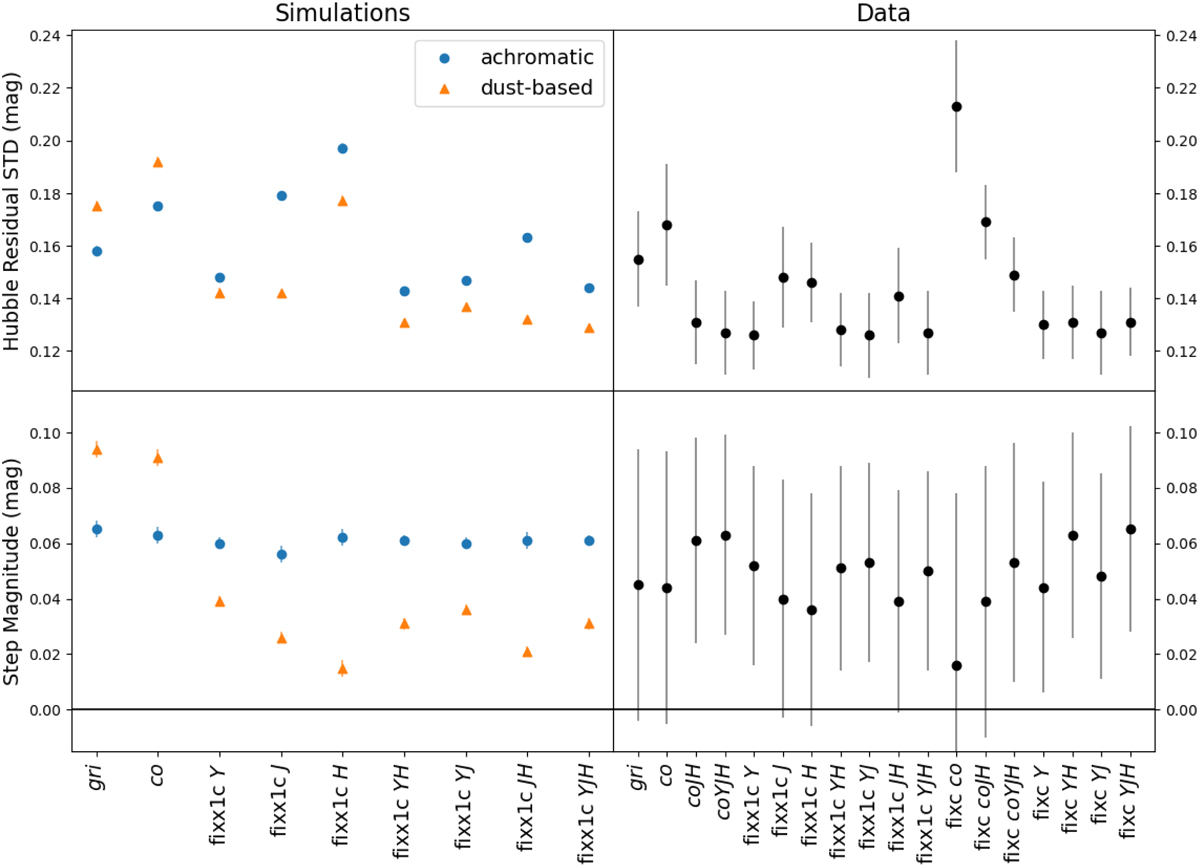
Fig. D.1
Download original image
Visualizing Hubble residual STD values (upper panels) and mass step values (lower panels) from simulations in Tables D.1 and D.2 (left panels) and data in Table D.3 (right panels). Nomenclature in the x-axis labels goes as follows: filters fit are given along with a descriptor such as “fixx1c” which corresponds to fixed x1 and c, “fixc” which corresponds to fixed c and fitted x1, or no descriptor which corresponds to fitted x1 and c. This is an expansion of Fig. 2.
Current usage metrics show cumulative count of Article Views (full-text article views including HTML views, PDF and ePub downloads, according to the available data) and Abstracts Views on Vision4Press platform.
Data correspond to usage on the plateform after 2015. The current usage metrics is available 48-96 hours after online publication and is updated daily on week days.
Initial download of the metrics may take a while.