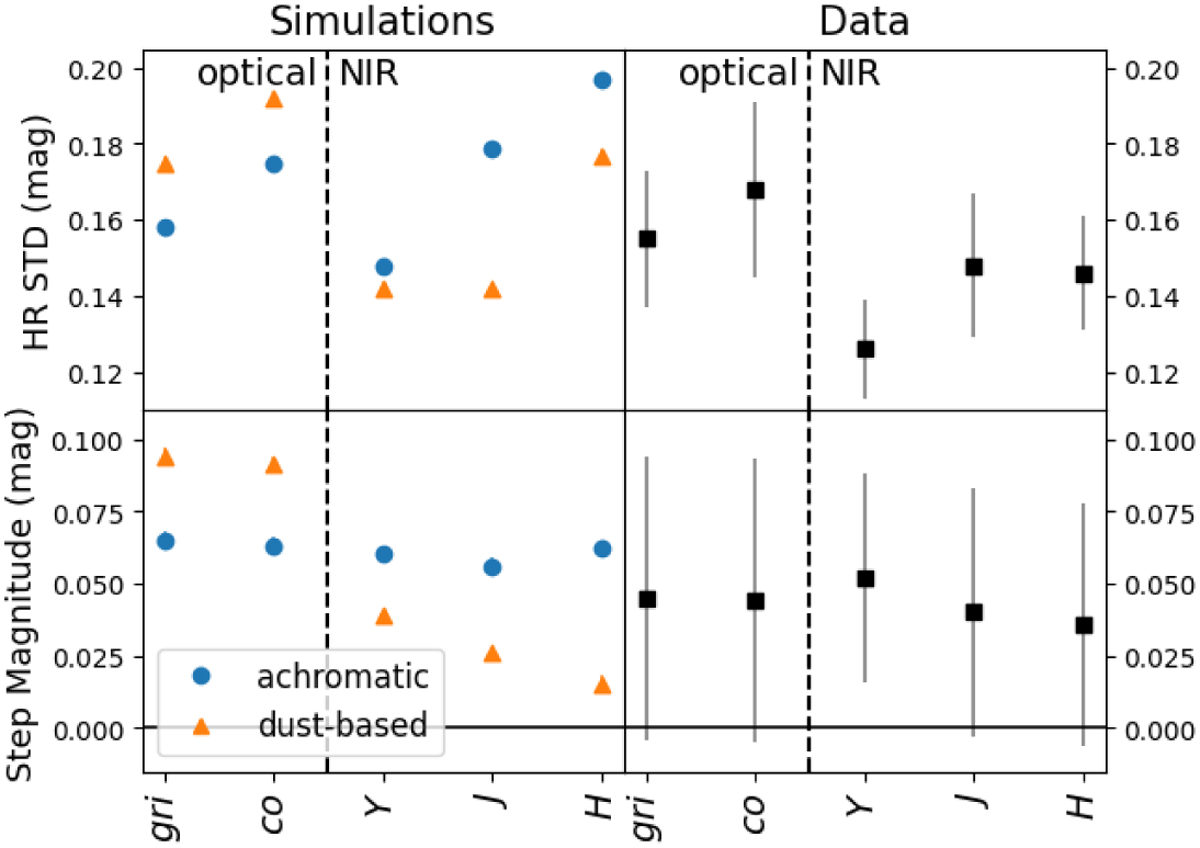
Fig. 2
Download original image
Visualizing Hubble residual standard deviation (STD) values and mass step values from Tables 1 and 2 in the upper and lower panels, respectively. Values from simulations using the achromatic model are indicated with blue circles, and values from simulations using the dust-based model are indicated with orange triangles in the left panels. Data values are indicated with black squares in the right panels.
Current usage metrics show cumulative count of Article Views (full-text article views including HTML views, PDF and ePub downloads, according to the available data) and Abstracts Views on Vision4Press platform.
Data correspond to usage on the plateform after 2015. The current usage metrics is available 48-96 hours after online publication and is updated daily on week days.
Initial download of the metrics may take a while.