Fig. 5
Download original image
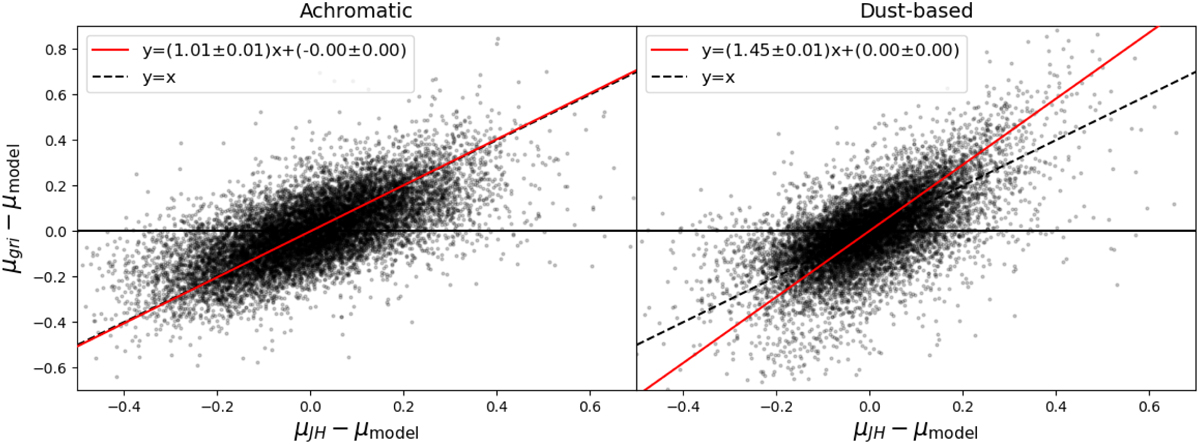
Hubble residual comparisons between simulated optical data (gri with stretch and color corrections) and simulated NIR data (JH without stretch or color corrections). Each panel is fit using orthogonal distance regression and the results are given in red. The left panel is with the achromatic model while the right panel is with the dust-based model.
Current usage metrics show cumulative count of Article Views (full-text article views including HTML views, PDF and ePub downloads, according to the available data) and Abstracts Views on Vision4Press platform.
Data correspond to usage on the plateform after 2015. The current usage metrics is available 48-96 hours after online publication and is updated daily on week days.
Initial download of the metrics may take a while.