Fig. 1
Download original image
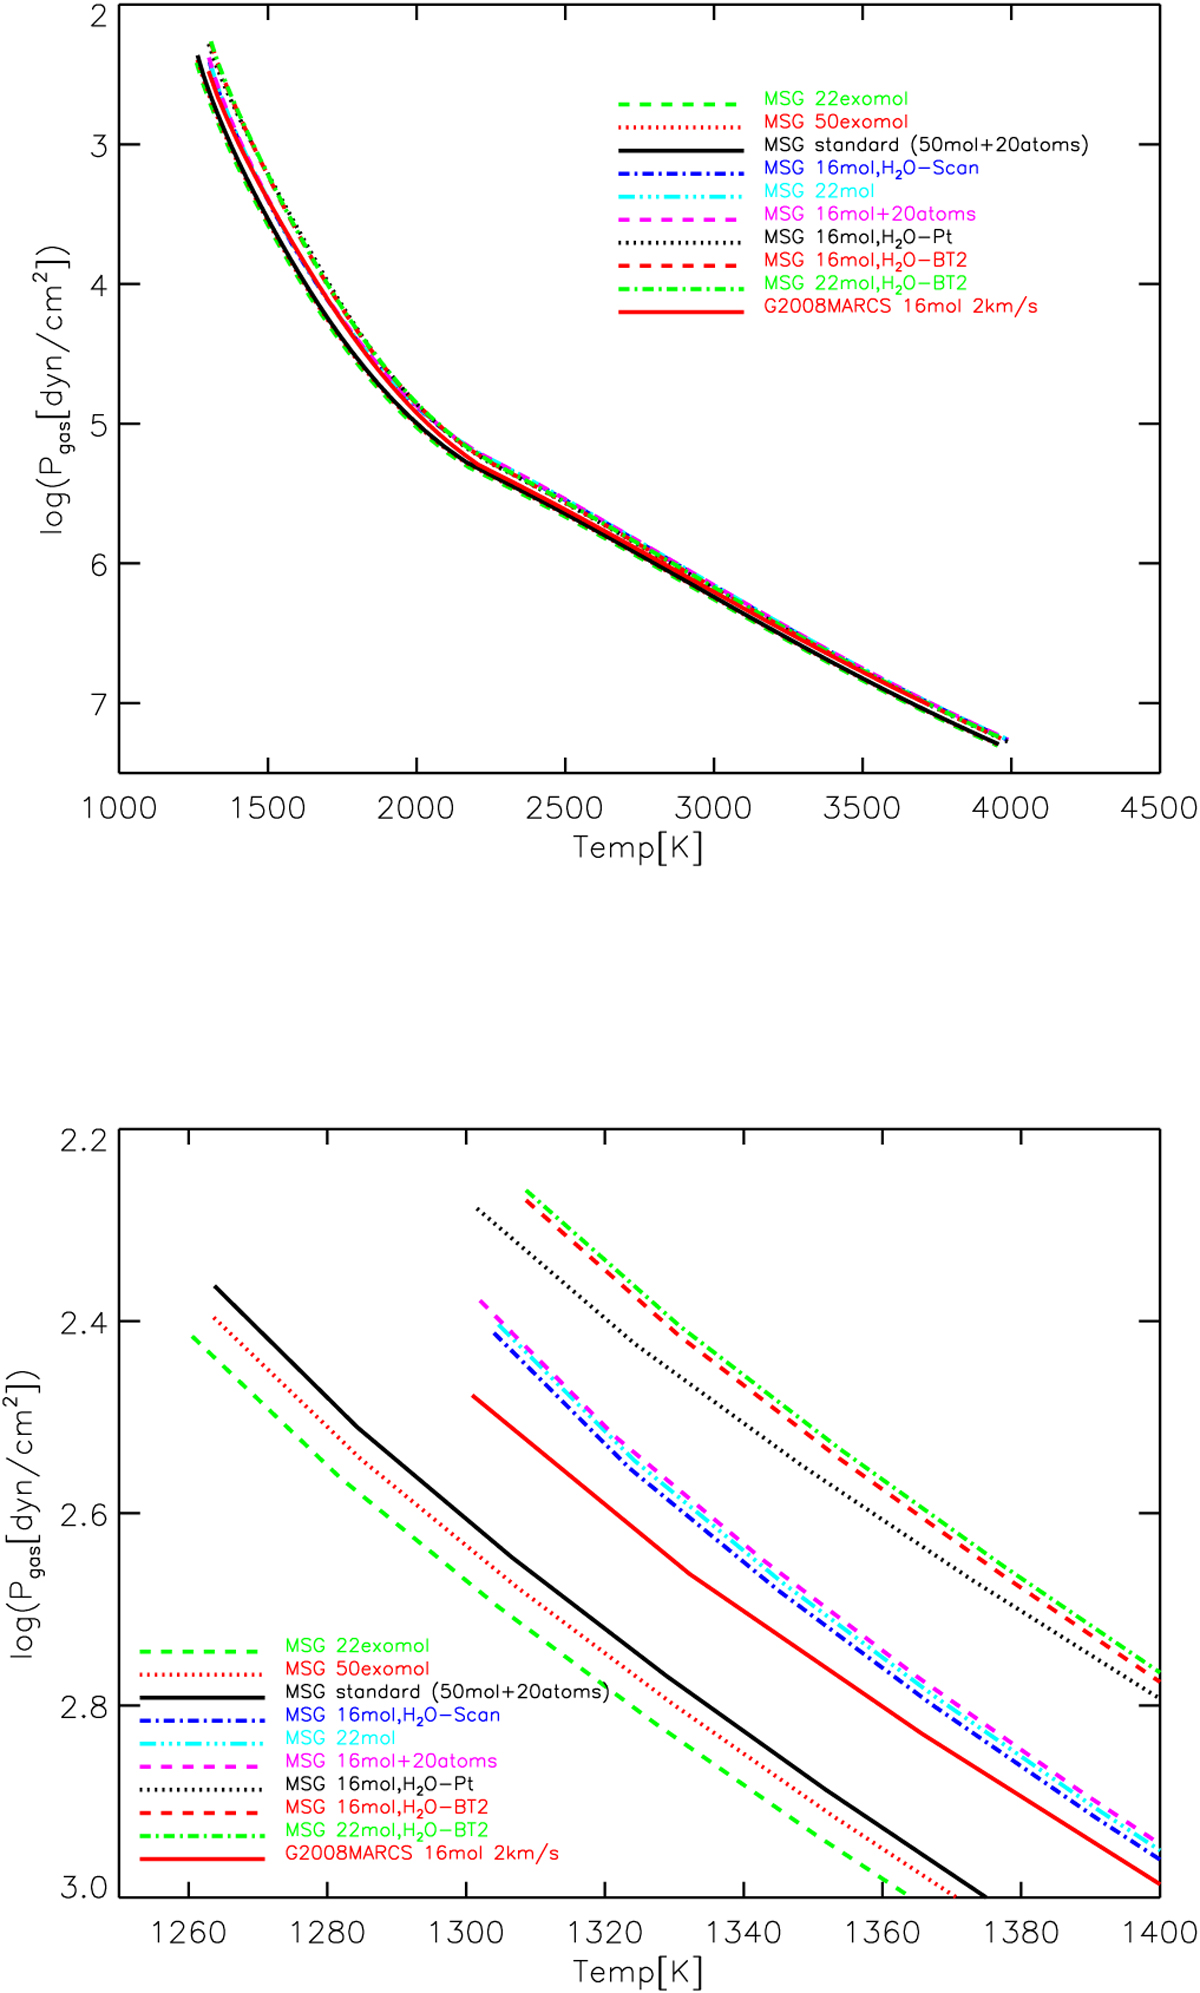
Comparison of the classical 2008 MARCS model at the lower boundary of the 2008 grid (labeled ‘G2008-MARCS’) with models computed with the MSG code and based on various levels of completeness and choices of input data as described in the text. Models labeled ‘MSG 22…mol..’ are based on molecular opacities from the 22 molecules included in the DRIFT-MARCS computations, while models labeled ‘MSG 16mol…’ are based on opacities from the 16 molecules included in the classical MARCS grid. Upper panel show the T–Pg structure of the full models from log(τross) = –5.0 to +2.5 while the lower panel zooms in on the upper part of the atmosphere.
Current usage metrics show cumulative count of Article Views (full-text article views including HTML views, PDF and ePub downloads, according to the available data) and Abstracts Views on Vision4Press platform.
Data correspond to usage on the plateform after 2015. The current usage metrics is available 48-96 hours after online publication and is updated daily on week days.
Initial download of the metrics may take a while.