Fig. 12
Download original image
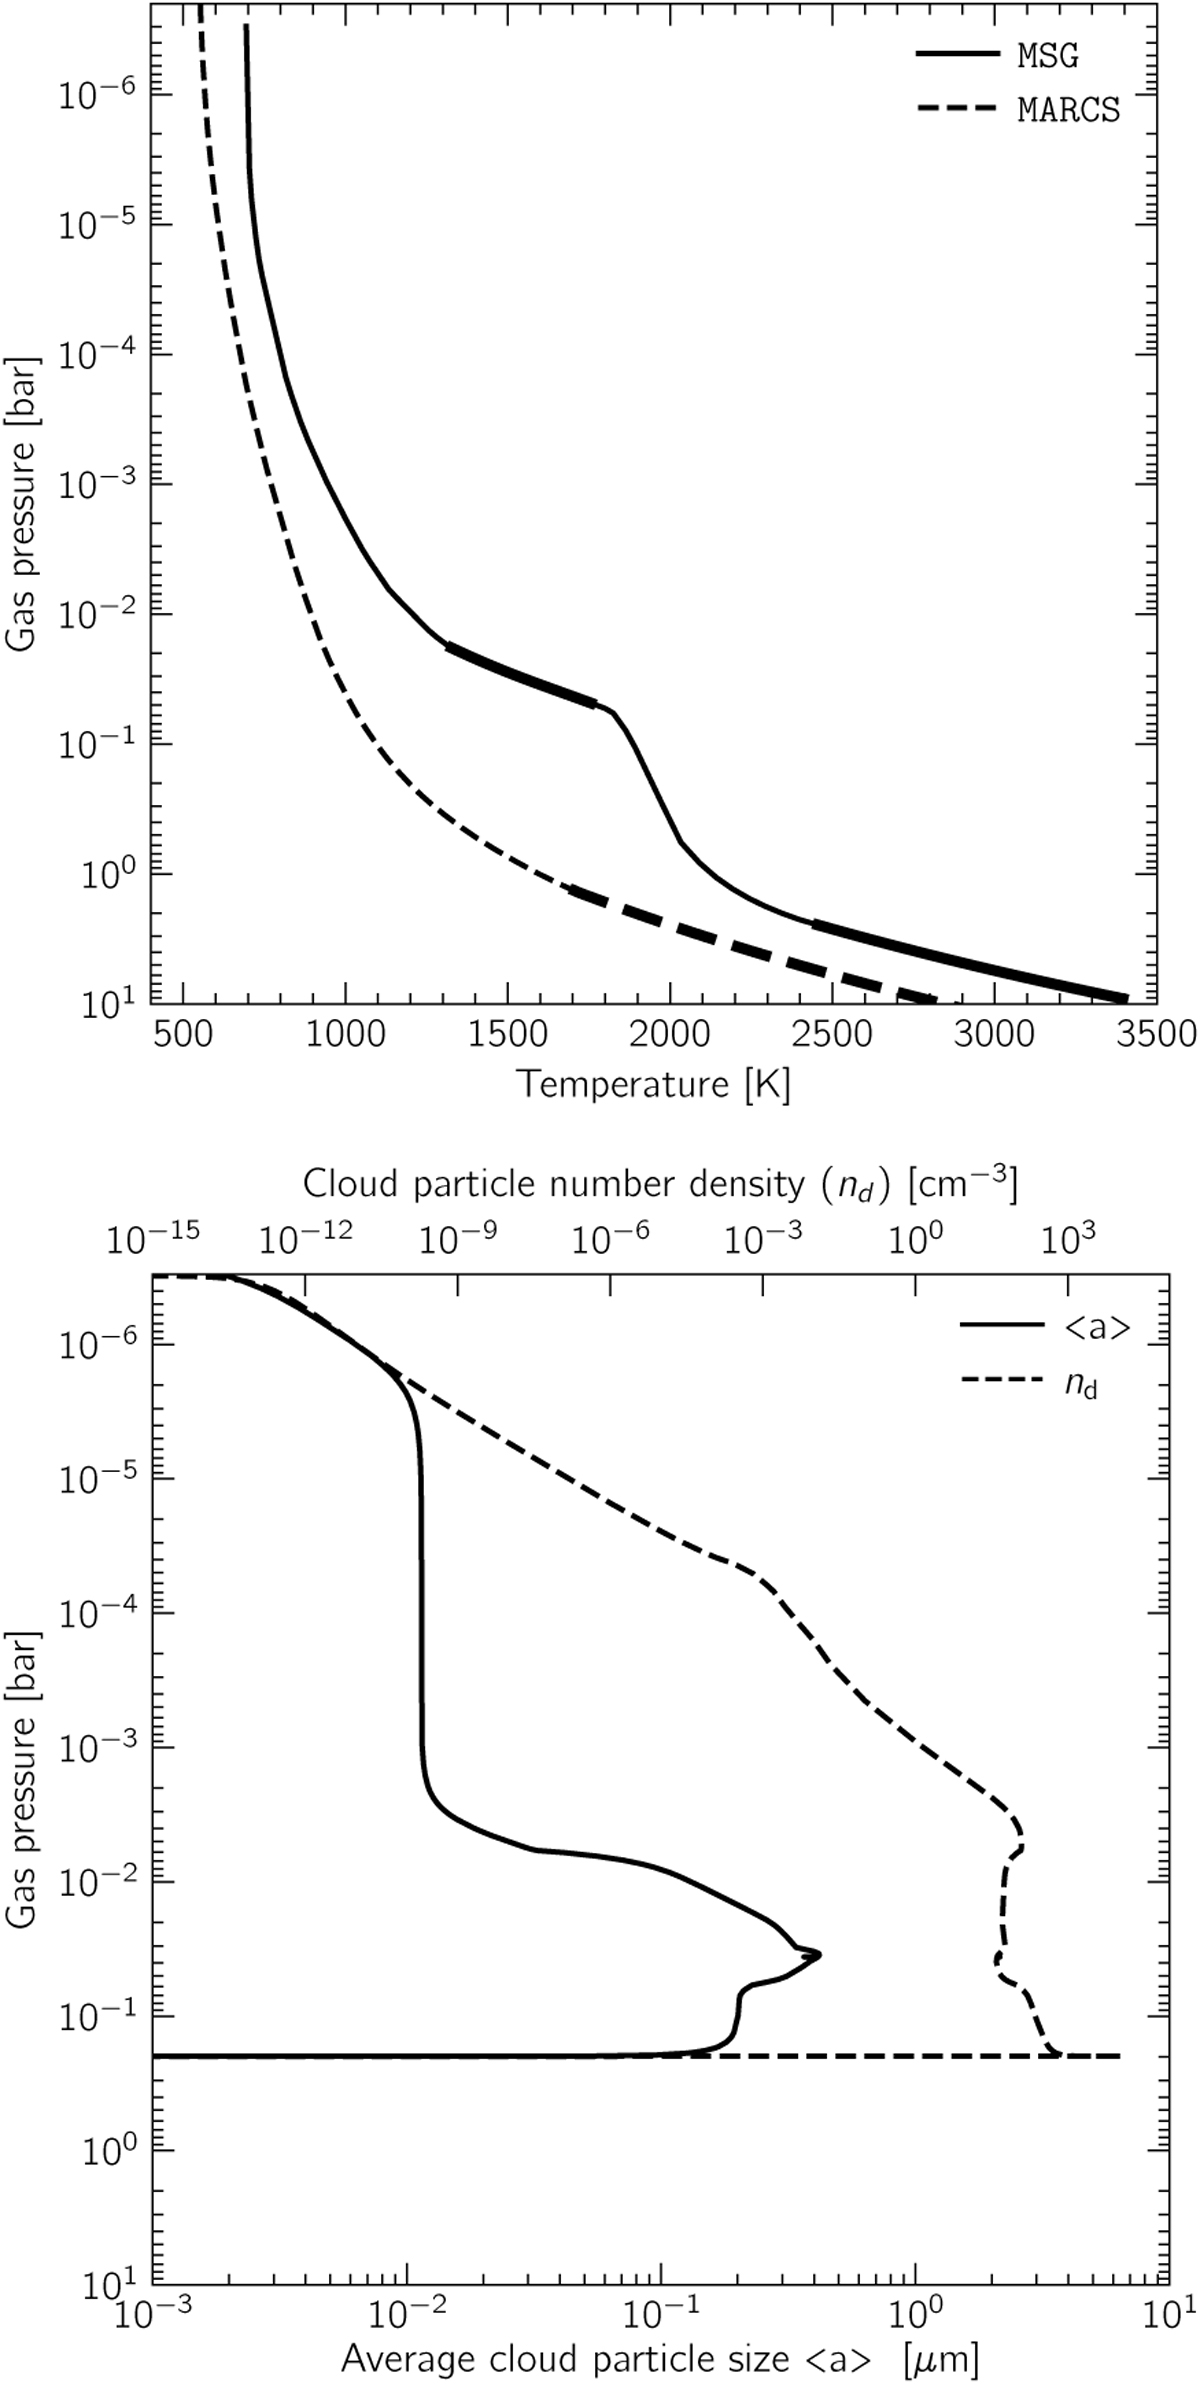
Effects of clouds in a Teff =1500K model atmosphere. Upper panel: pressure–temperature profiles for MSG models at Teff =1500K and log(g)=4.0 respectively with clouds (labeled MSG) and without clouds (labeled MARCS). We note that the convective part of the atmosphere is represented with a thicker line. Lower panel: average cloud particle size (solid curve) and cloud particle number density (dashed curve) for the MSG model shown in the upper panel. We note that the spike in the number density at the bottom of the cloud is numerical and due to the rapid decrease of the average cloud particle size.
Current usage metrics show cumulative count of Article Views (full-text article views including HTML views, PDF and ePub downloads, according to the available data) and Abstracts Views on Vision4Press platform.
Data correspond to usage on the plateform after 2015. The current usage metrics is available 48-96 hours after online publication and is updated daily on week days.
Initial download of the metrics may take a while.