Fig. 21
Download original image
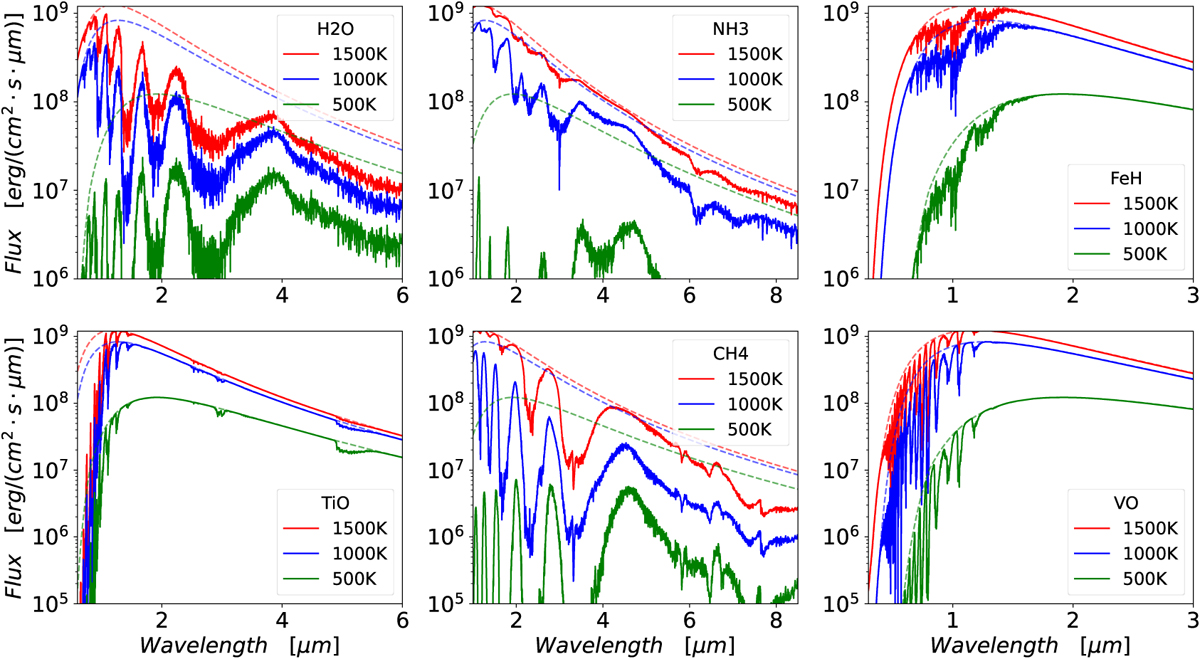
Development of the spectrum of H2O and TiO (the two left panels), CH4, and NH3 (middle panels) and FeH and VO (right panels) for models of Teff = 1500 K (red), 1000 K (blue), and 500 K (green). The dashed curves are the true continua (i.e. the spectrum computed by allowing only the continuum opacities into the spectrum computation, but all opacity sources into the model computation), while the full drawn lines likewise are the spectra of each individual molecule listed in the legend, computed by allowing the opacity from only that molecule in the spectrum computation, but all opacity sources into the model computation. Remark that for the coolest models (and the plotted resolution) the combined spectra do not at any place reach even close to the (true) continuum, which is the continuum that should be the reference in abundance analyses.
Current usage metrics show cumulative count of Article Views (full-text article views including HTML views, PDF and ePub downloads, according to the available data) and Abstracts Views on Vision4Press platform.
Data correspond to usage on the plateform after 2015. The current usage metrics is available 48-96 hours after online publication and is updated daily on week days.
Initial download of the metrics may take a while.