Open Access
Fig. 9
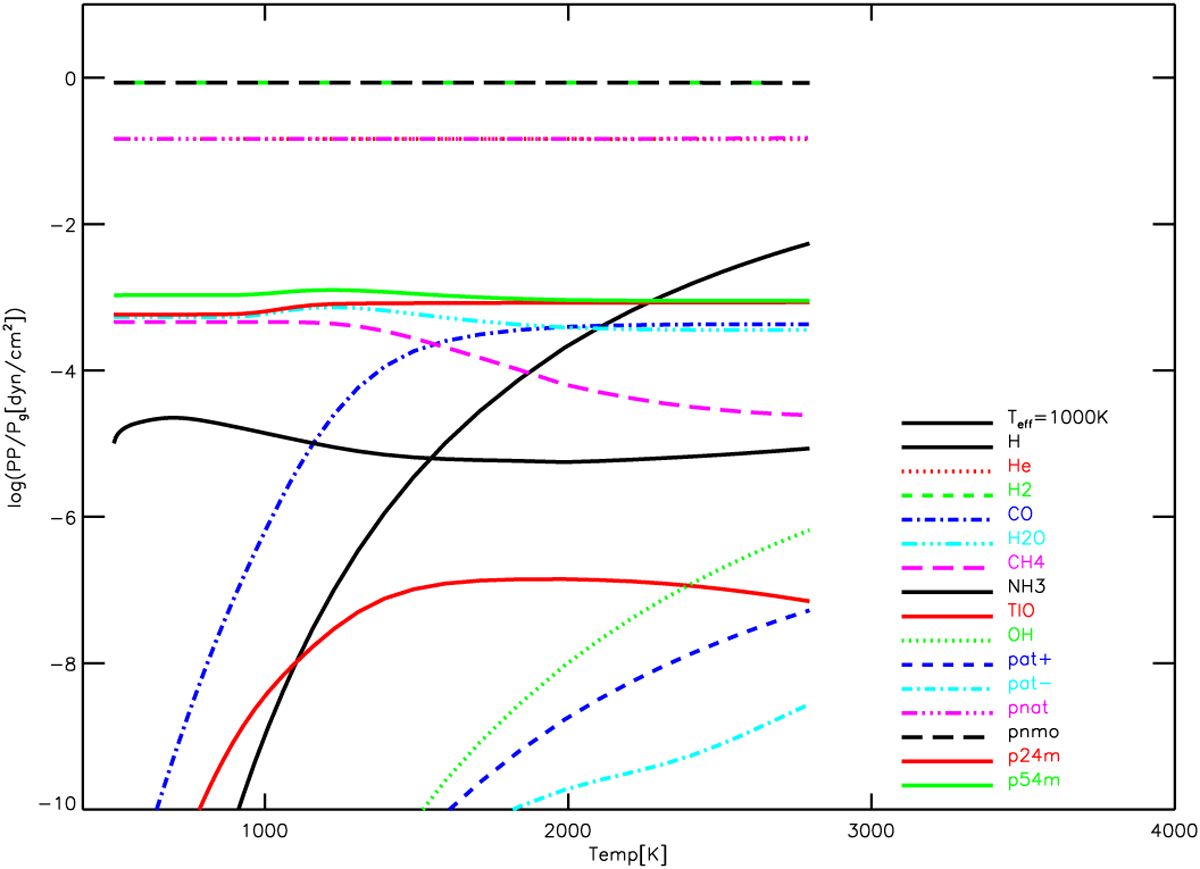
Download original image
Same as Fig. 8 but for at model of Teff =1000 K. We note that for this model the curves p24m and p54m do deviate, in particular for the upper layers, illustrating the importance of the additional molecular opacities in the MSG models compared to the classical MARCS models.
Current usage metrics show cumulative count of Article Views (full-text article views including HTML views, PDF and ePub downloads, according to the available data) and Abstracts Views on Vision4Press platform.
Data correspond to usage on the plateform after 2015. The current usage metrics is available 48-96 hours after online publication and is updated daily on week days.
Initial download of the metrics may take a while.