Fig. 2
Download original image
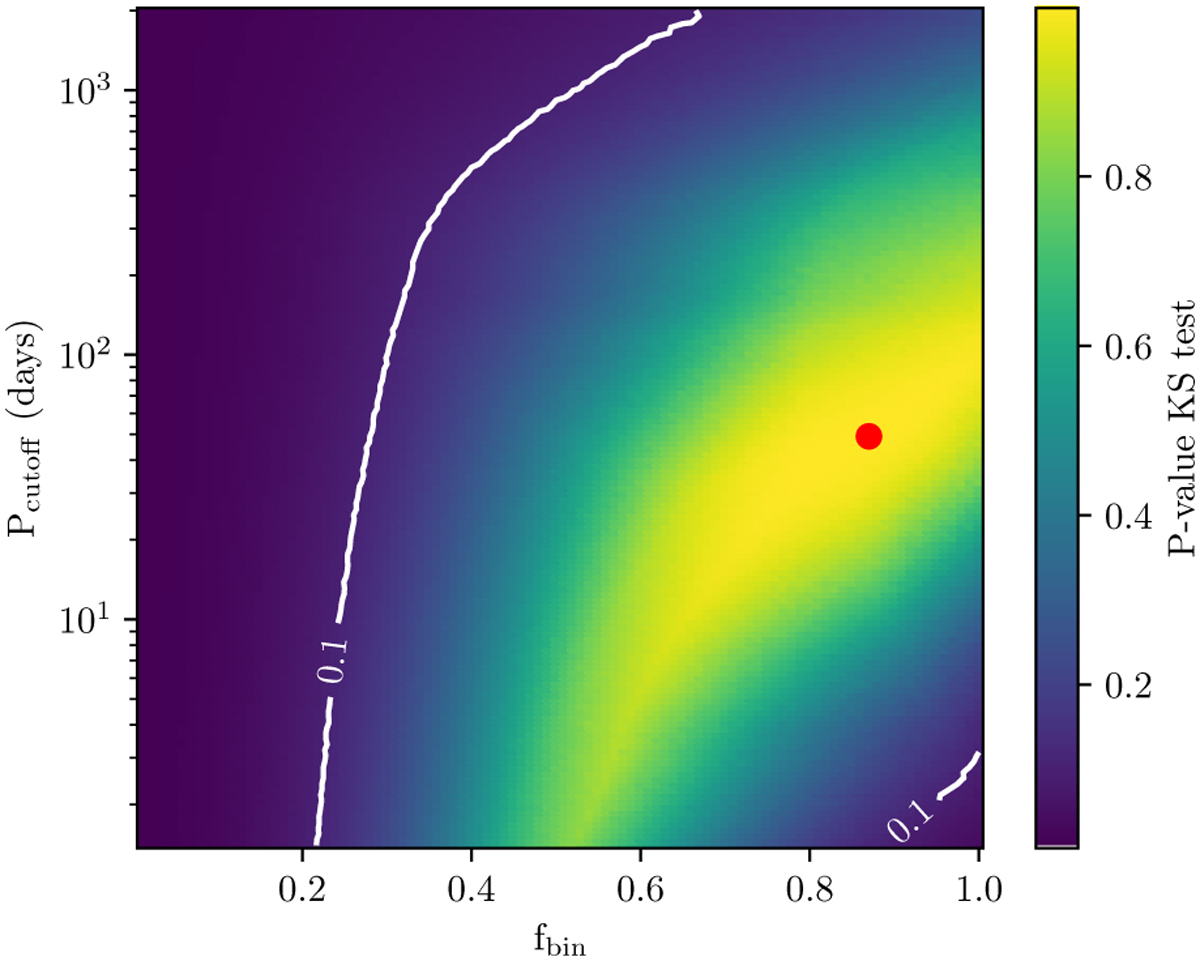
p-values (color bar) for the KS-test obtained from comparing the ΔRV from our observations to that of simulated populations with different combinations of fbin and Pcutoff. The white line indicates the 0.1 contour outside of which we can reject the null hypothesis that the simulated populations are drawn from the same parent population as our observations. The red dot at fbin = 87% and Pcutoff = 50 days shows the population that best represents our observations.
Current usage metrics show cumulative count of Article Views (full-text article views including HTML views, PDF and ePub downloads, according to the available data) and Abstracts Views on Vision4Press platform.
Data correspond to usage on the plateform after 2015. The current usage metrics is available 48-96 hours after online publication and is updated daily on week days.
Initial download of the metrics may take a while.