Fig. 3
Download original image
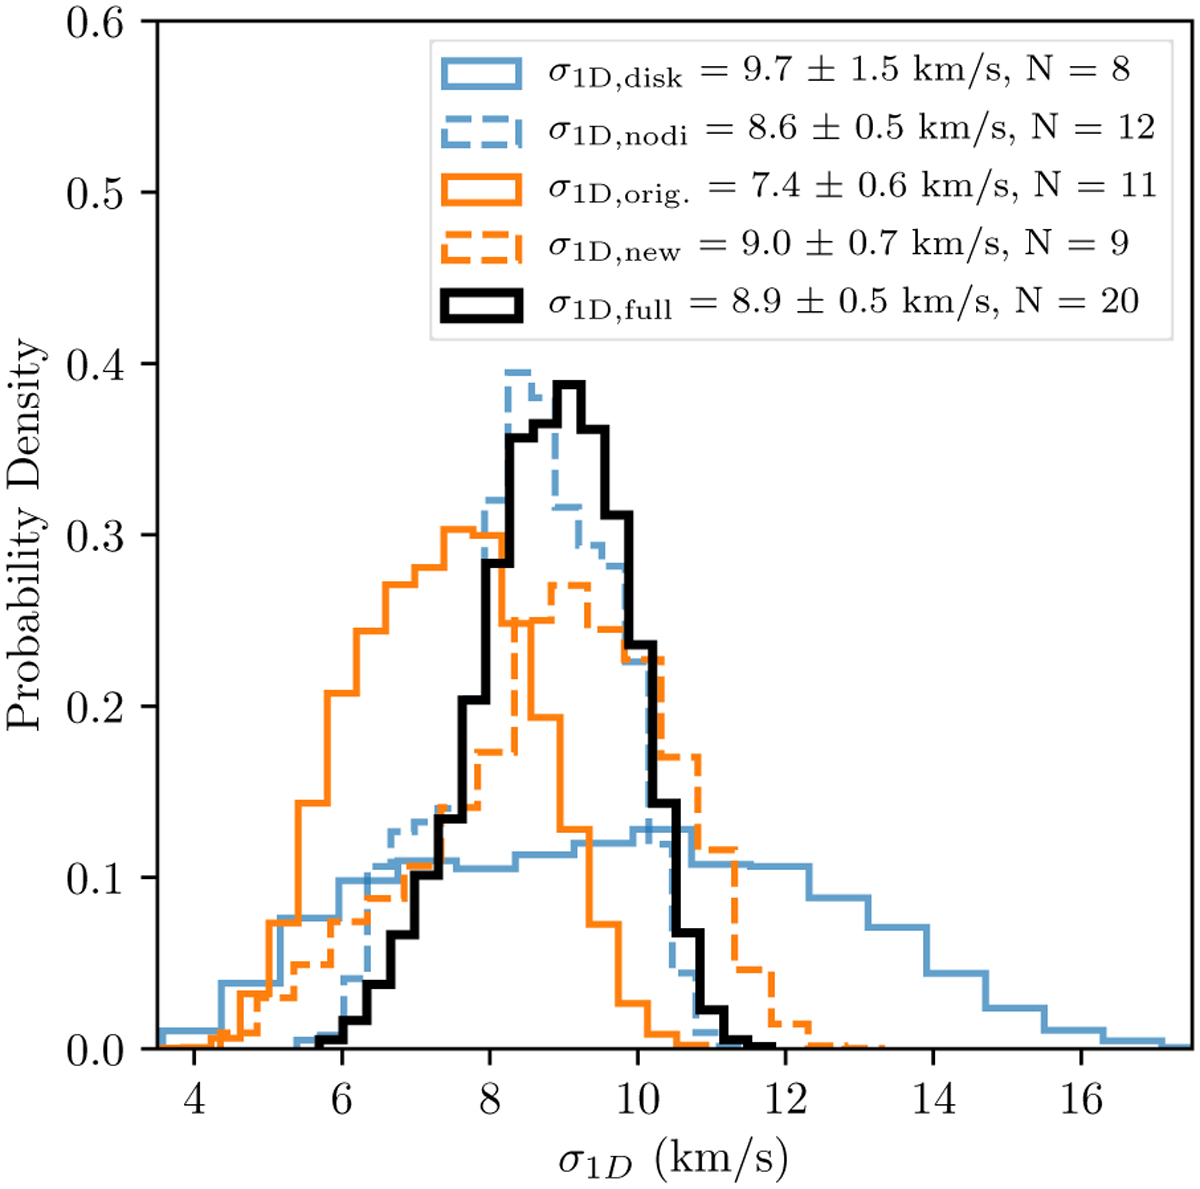
σ1D for our full sample and for subsamples thereof. The full sample is shown with the solid black line. The orange lines show the 11 stars from Sana et al. (2017) (dashed line) and the nine new stars added to the sample in this paper (solid line). The blue lines show the sample divided in stars with (solid line) and without disks (dashed line).
Current usage metrics show cumulative count of Article Views (full-text article views including HTML views, PDF and ePub downloads, according to the available data) and Abstracts Views on Vision4Press platform.
Data correspond to usage on the plateform after 2015. The current usage metrics is available 48-96 hours after online publication and is updated daily on week days.
Initial download of the metrics may take a while.