Fig. 4
Download original image
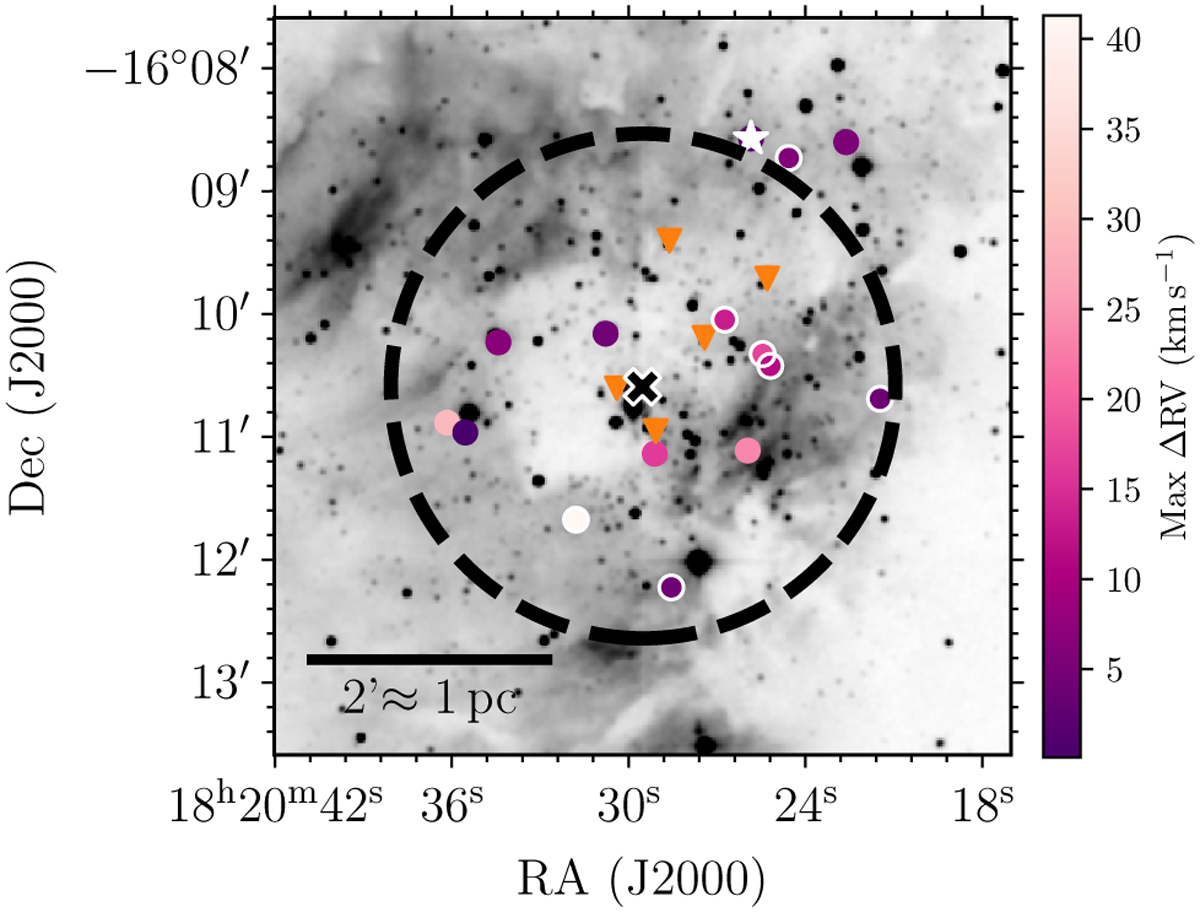
Location of our targets with respect to the center of M17. The dashed circle shows the size of the cluster (~2′; Stoop et al. 2024), centered on the position of CEN lab (black cross). The color bar represents the maximum RV difference between any two epochs for the sources with multi-epoch spectra. The sources with disks are marked with white edges and the SB2 326 is shown with a white star. The position of the sources with single-epoch observations is shown with an orange triangle. The figure shows that there are no indications that the location of the shortest-period binaries is dependent on distance to the cluster center.
Current usage metrics show cumulative count of Article Views (full-text article views including HTML views, PDF and ePub downloads, according to the available data) and Abstracts Views on Vision4Press platform.
Data correspond to usage on the plateform after 2015. The current usage metrics is available 48-96 hours after online publication and is updated daily on week days.
Initial download of the metrics may take a while.