Fig. 1.
Download original image
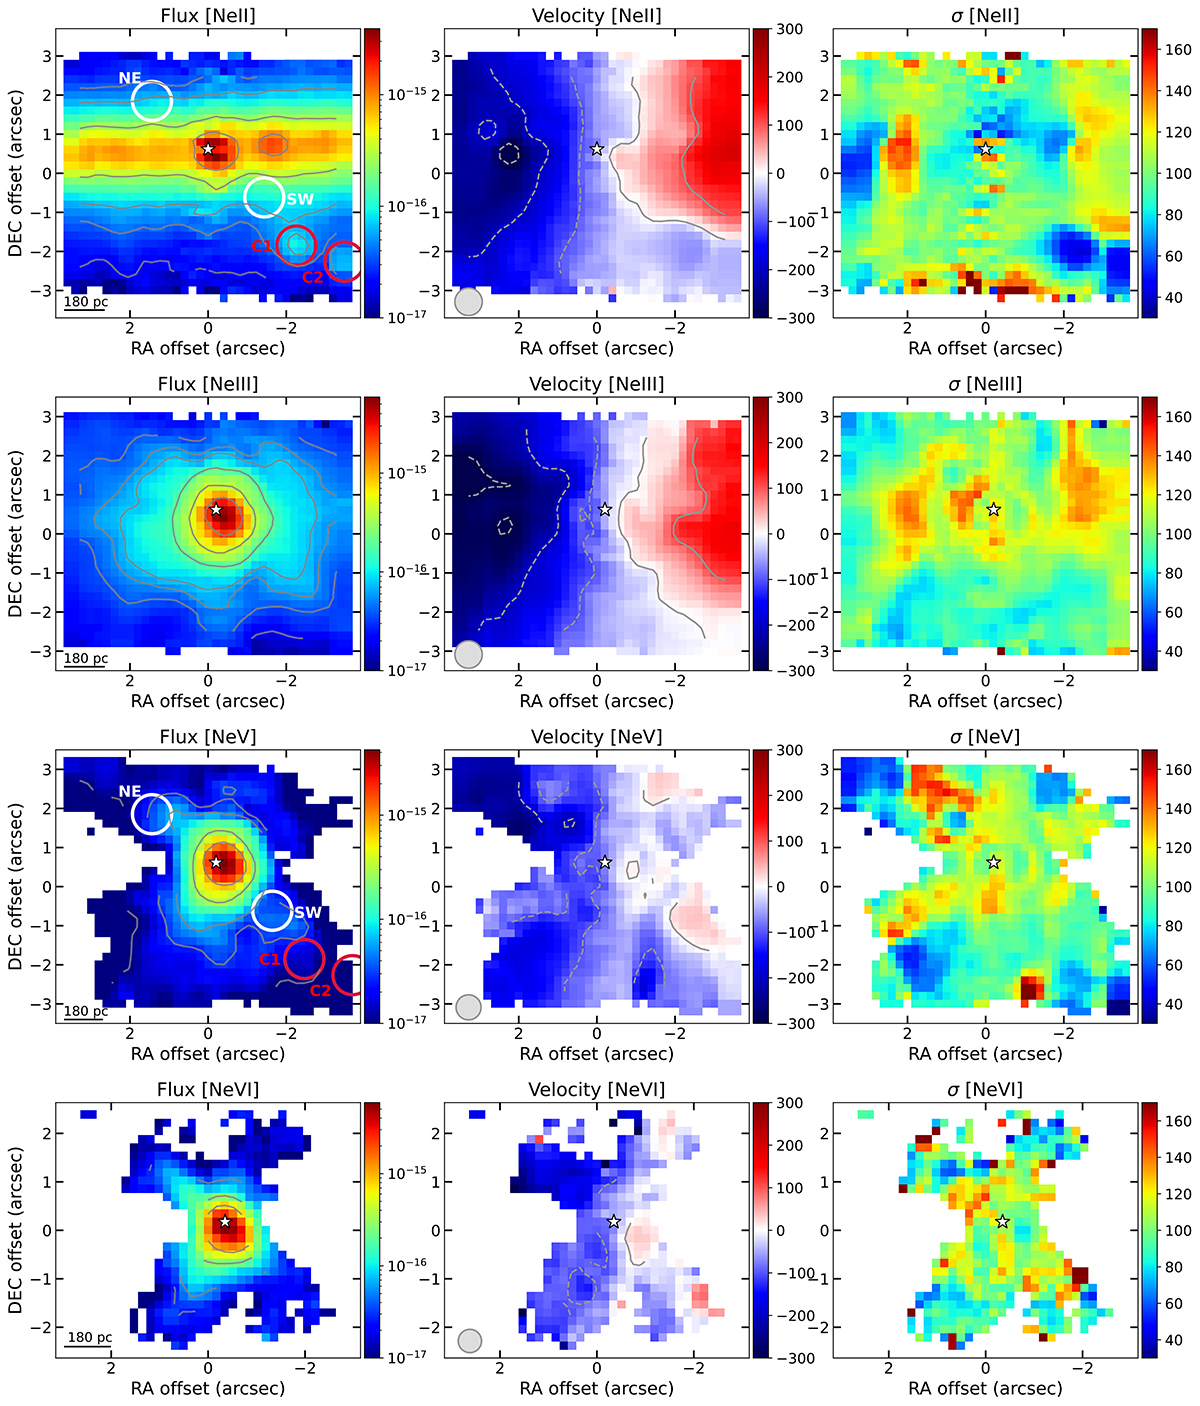
Maps of (from top to bottom) the [Ne II], [Ne III], [Ne V], and [Ne VI] emission lines fitted with one Gaussian component (S/N > 3 at the line peak, see Sect. 2). From left to right, we show the flux maps in erg s−1 cm−2, the mean velocity, and the velocity dispersion, σ (corrected from the instrumental value), in km s−1. The photometric centre of the continuum for each channel is marked with a white star. The 1″ physical scale is marked with a black line in the left panels. The white and red circles in the [Ne II] and [Ne V] flux maps indicate the integrated regions discussed in the text (see Sect. 3). The FWHM of the PSF is shown as a grey circle in the middle panels. The contours in the velocity maps go from −300 to 300 km s−1. In all panels, north (east) is up (left).
Current usage metrics show cumulative count of Article Views (full-text article views including HTML views, PDF and ePub downloads, according to the available data) and Abstracts Views on Vision4Press platform.
Data correspond to usage on the plateform after 2015. The current usage metrics is available 48-96 hours after online publication and is updated daily on week days.
Initial download of the metrics may take a while.