Fig. 2
Download original image
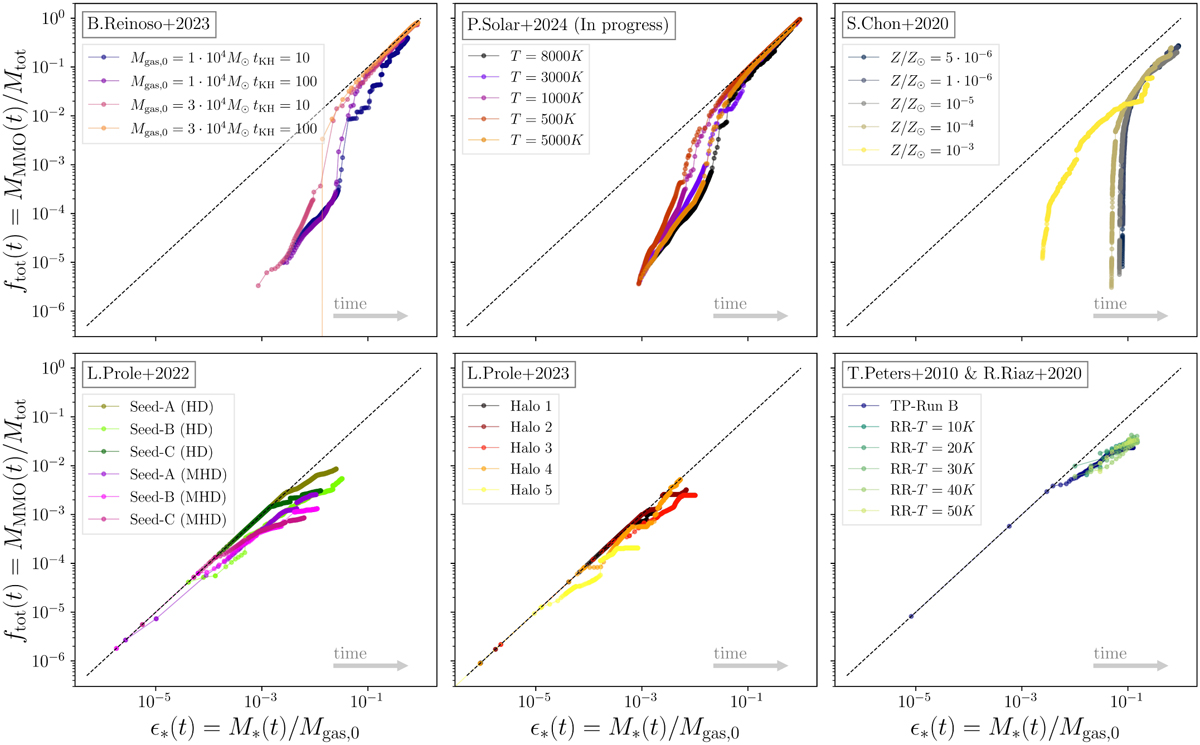
Fraction ftot of the mass of the most massive object MMMO normalized by the total mass Mtot as a function of the star formation efficiency ϵ* for the simulations summarized in Table 1. The black dotted line corresponds to the identity function, indicating the scenario where all the stellar mass is concentrated within the central object, representing the maximum possible value for ftot. The gray arrow indicates the direction of the time evolution. For those authors with more than 8 simulations, we display some representative examples.
Current usage metrics show cumulative count of Article Views (full-text article views including HTML views, PDF and ePub downloads, according to the available data) and Abstracts Views on Vision4Press platform.
Data correspond to usage on the plateform after 2015. The current usage metrics is available 48-96 hours after online publication and is updated daily on week days.
Initial download of the metrics may take a while.