Open Access
Fig. 5
Download original image
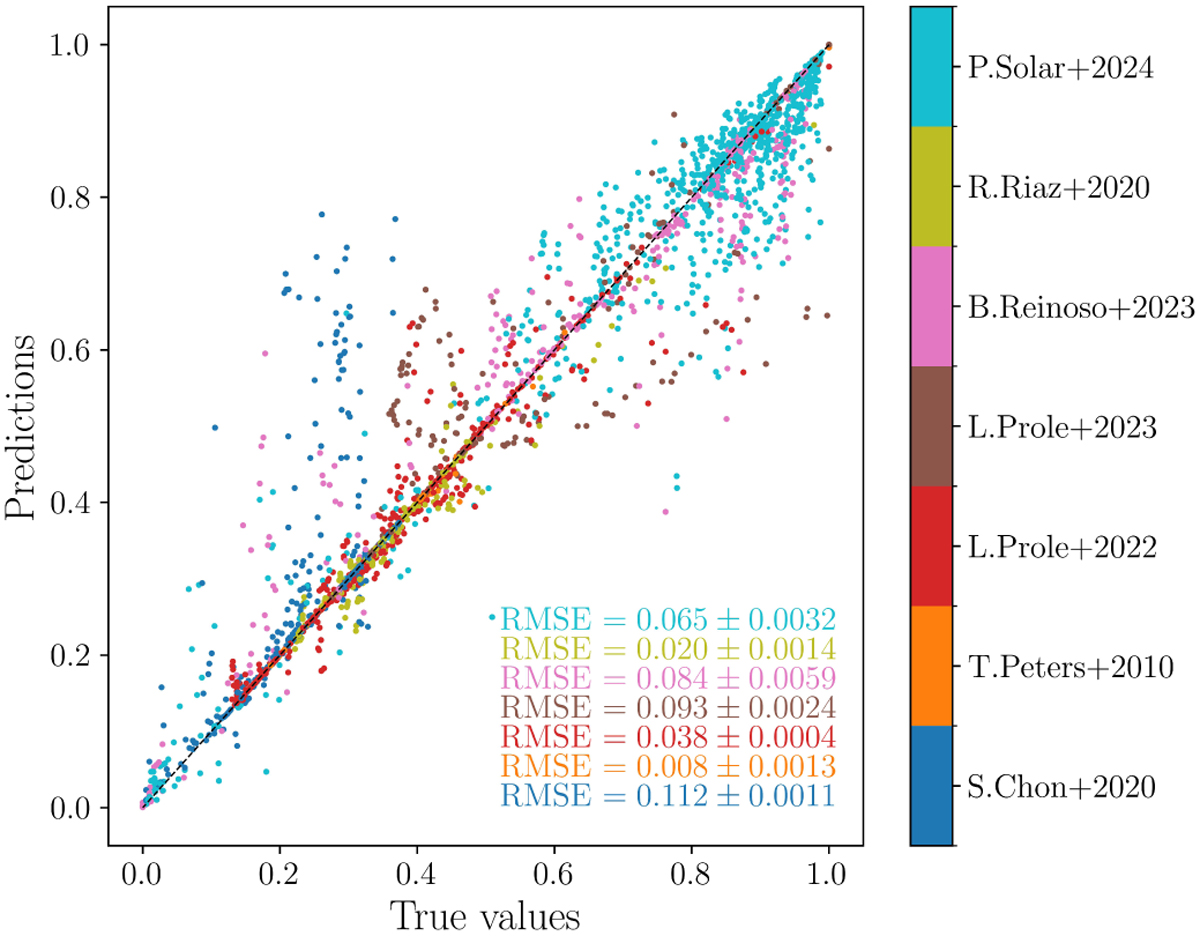
Correlation plot for the average of the ƒ* (t) predictions of the test set by RF. The color palette represents the different authors of the simulations, and we include the RMSE for each case.
Current usage metrics show cumulative count of Article Views (full-text article views including HTML views, PDF and ePub downloads, according to the available data) and Abstracts Views on Vision4Press platform.
Data correspond to usage on the plateform after 2015. The current usage metrics is available 48-96 hours after online publication and is updated daily on week days.
Initial download of the metrics may take a while.