Open Access
Fig. 7
Download original image
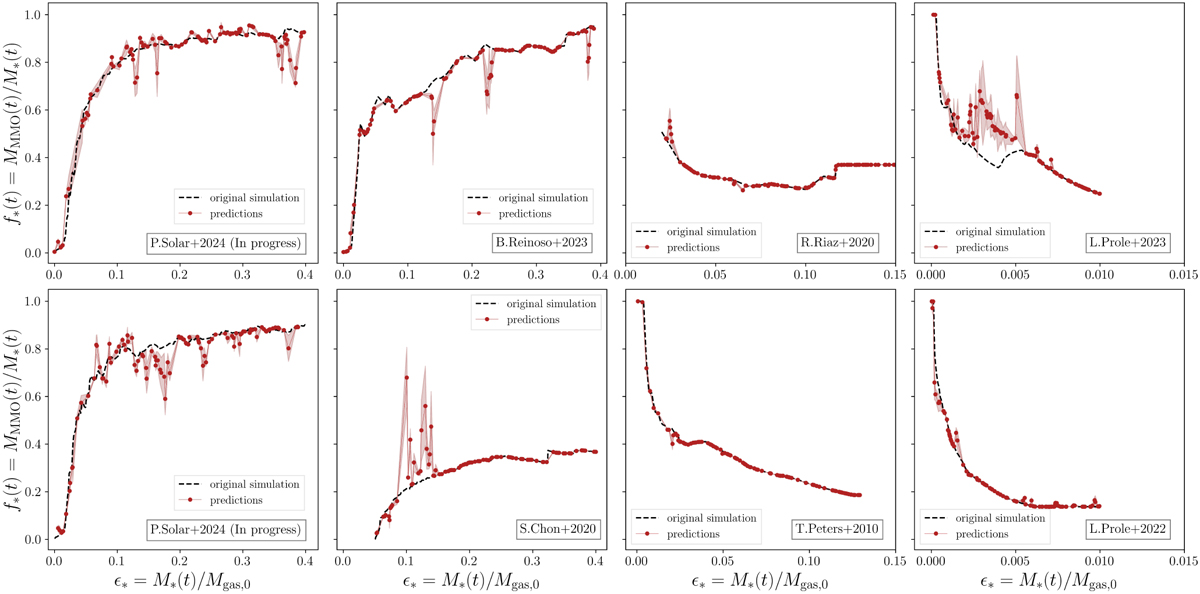
Predicted values for ƒ* (t) by RF are depicted. The dashed black line represents the values of the simulation, the red dots indicate the average of the predictions, and the shaded area represents the standard deviation of predictions. We present random examples for all authors and for different ranges of є* (t).
Current usage metrics show cumulative count of Article Views (full-text article views including HTML views, PDF and ePub downloads, according to the available data) and Abstracts Views on Vision4Press platform.
Data correspond to usage on the plateform after 2015. The current usage metrics is available 48-96 hours after online publication and is updated daily on week days.
Initial download of the metrics may take a while.