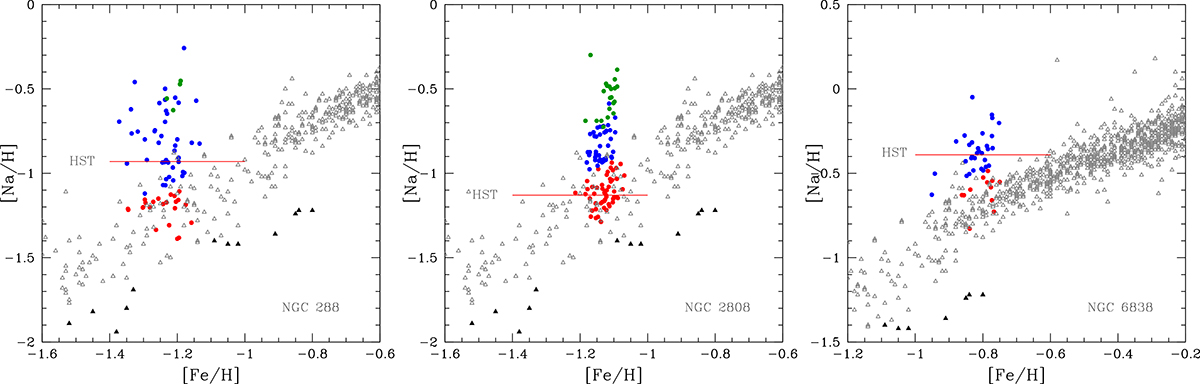
Fig. 11.
Download original image
Sodium distribution in the three GCs ouliers in Fig. 10 compared to the sample of field stars homogenized in Carretta (2013, triangles). Red, blue, and green filled circles are the P, I, and E components according to Carretta et al. (2009a). The red line reproduces the fraction of FG stars according to Milone et al. (2017) from PCMs (see text). From left to right, the panels are for NGC 288, NGC 2808, and NGC 6838.
Current usage metrics show cumulative count of Article Views (full-text article views including HTML views, PDF and ePub downloads, according to the available data) and Abstracts Views on Vision4Press platform.
Data correspond to usage on the plateform after 2015. The current usage metrics is available 48-96 hours after online publication and is updated daily on week days.
Initial download of the metrics may take a while.