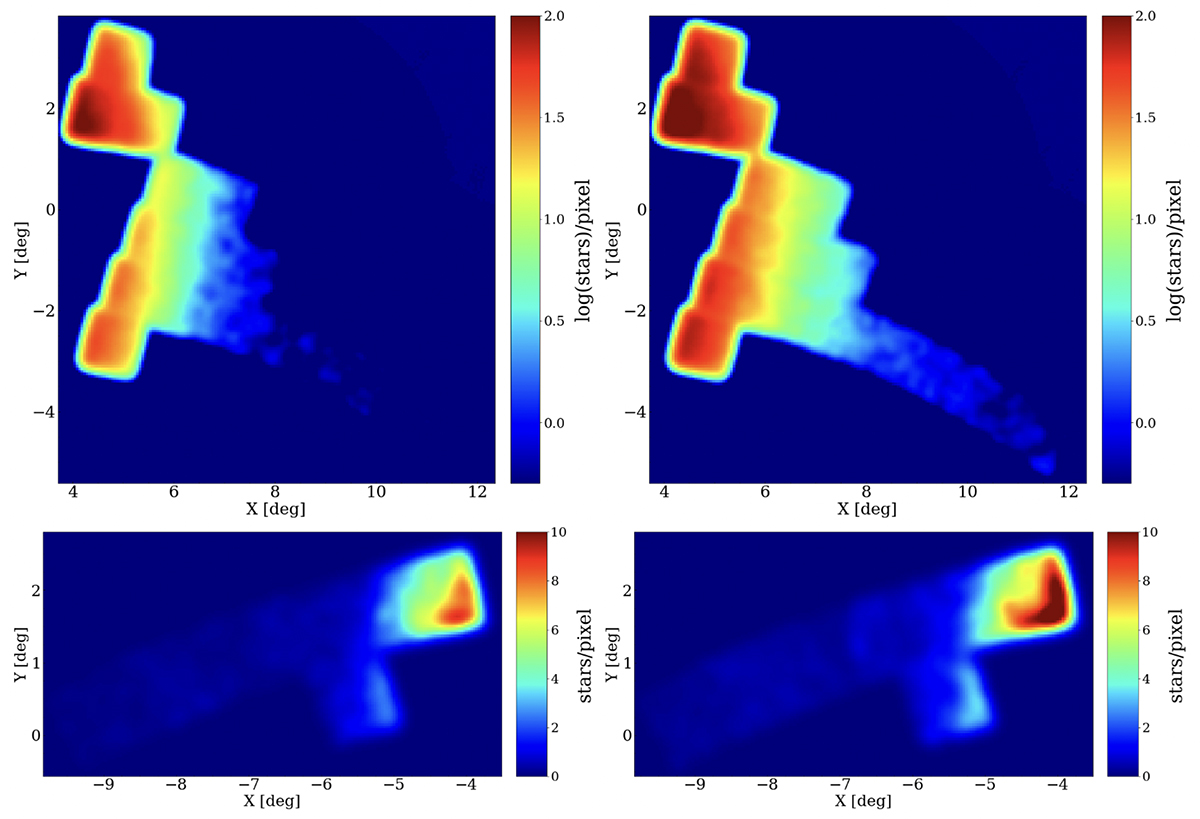
Fig. 10.
Download original image
Density map of the strip. Top: region close the LMC, derived by adopting MSTO stars corresponding to intermediate-age (7 ≤ t ≤ 9 Gyr, left panel) and old (t ≥ 10 Gyr, right panel) stellar populations. We selected stars within colour and magnitude ranges of 0.0 ≤ 0.5 mag and 21.4 ≤ g ≤ 21.9 mag for the younger stellar population, and 0.1 ≤ g − i ≤ 0.6 mag and 21.9 ≤ g ≤ 22.4 mag, for the old one, respectively. Each pixel has size of 3′×3′. Bottom: region close the SMC. The region of the CMD adopted to select SMC MSTO stars is 0.0 ≤ g − i ≤ 0.5 mag and 21.8 ≤ g ≤ 22.3 mag for the younger stellar population, and 0.1 ≤ g − i ≤ 0.6 mag and 22.3 ≤ g ≤ 22.8 mag for the ancient one, respectively. Each pixel has size of 2′×2′. We applied a Gaussian Kernel Density Estimator with bandwidth = 0.1° for smoothing all four subplots.
Current usage metrics show cumulative count of Article Views (full-text article views including HTML views, PDF and ePub downloads, according to the available data) and Abstracts Views on Vision4Press platform.
Data correspond to usage on the plateform after 2015. The current usage metrics is available 48-96 hours after online publication and is updated daily on week days.
Initial download of the metrics may take a while.