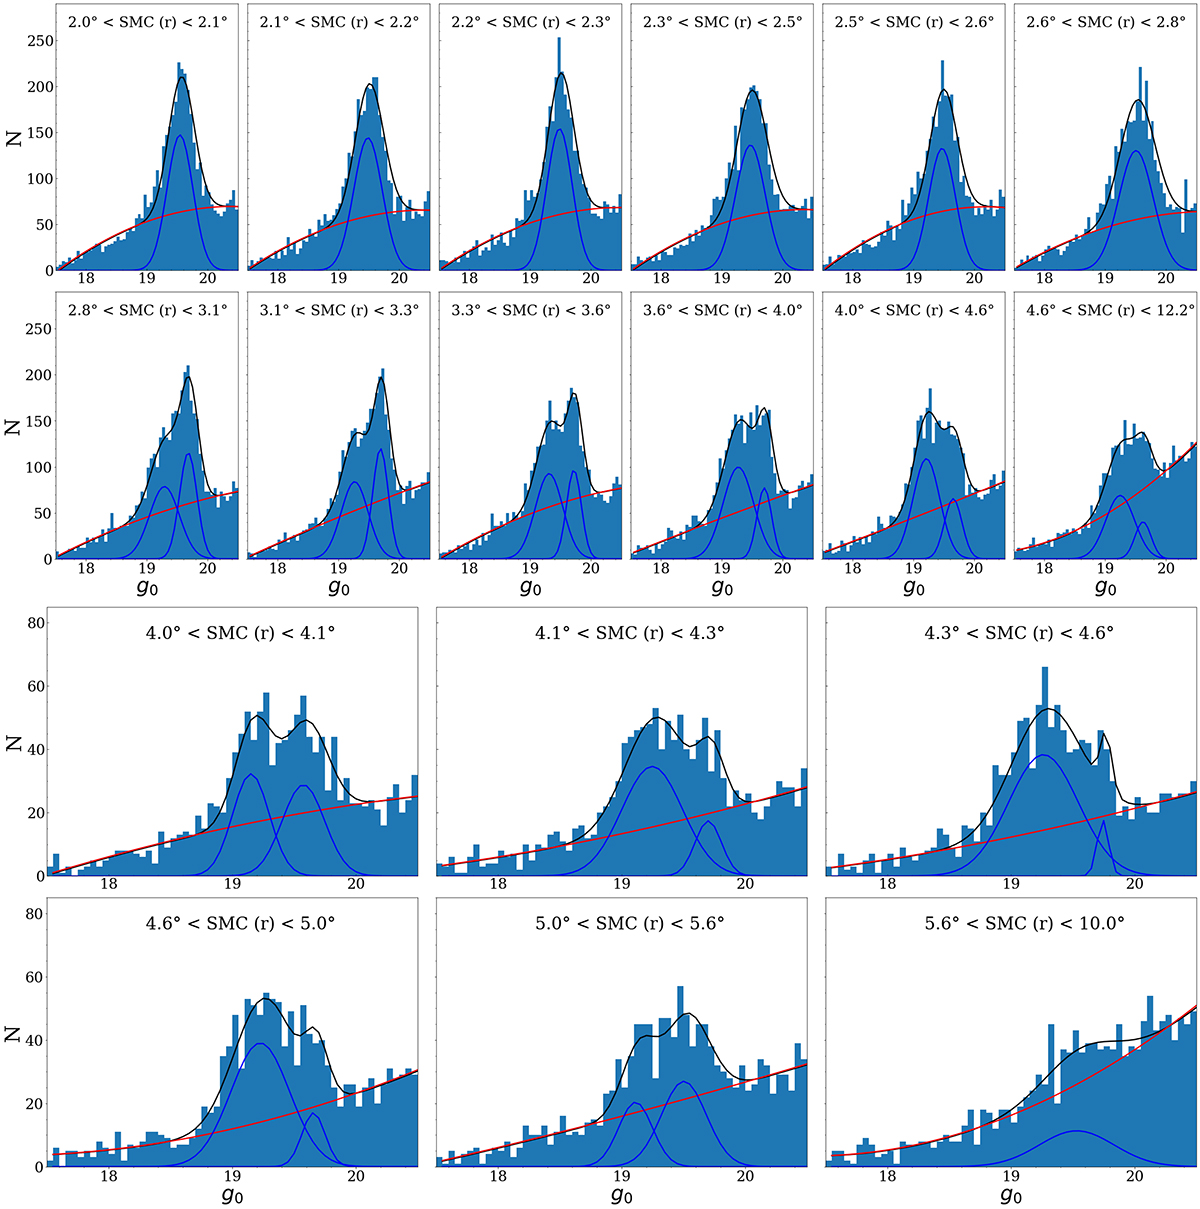
Fig. 11.

Download original image
Magnitude distribution in the g band for stars included in both the YMCA and STEP catalogues and having the position angle in the range 55 ° ≤PA ≤ 95°. The panels in the first two rows display ∼4360 stars with magnitudes between g0 = 17.5 mag and g0 = 20.5 mag, while the panels in the last two rows contain ∼1370 stars within the same range of magnitudes. At the top of each sub-panel the interval of distances from the SMC centre is reported. The blue solid lines represent the Gaussian distributions of RC stars, whereas the red solid line is the quadratic polynomial modeling the distribution of stars along the RGB. The black solid line illustrates the best-fit model derived from the combined contributions of both stellar evolutionary phases.
Current usage metrics show cumulative count of Article Views (full-text article views including HTML views, PDF and ePub downloads, according to the available data) and Abstracts Views on Vision4Press platform.
Data correspond to usage on the plateform after 2015. The current usage metrics is available 48-96 hours after online publication and is updated daily on week days.
Initial download of the metrics may take a while.


