Open Access
Fig. 16.
Download original image
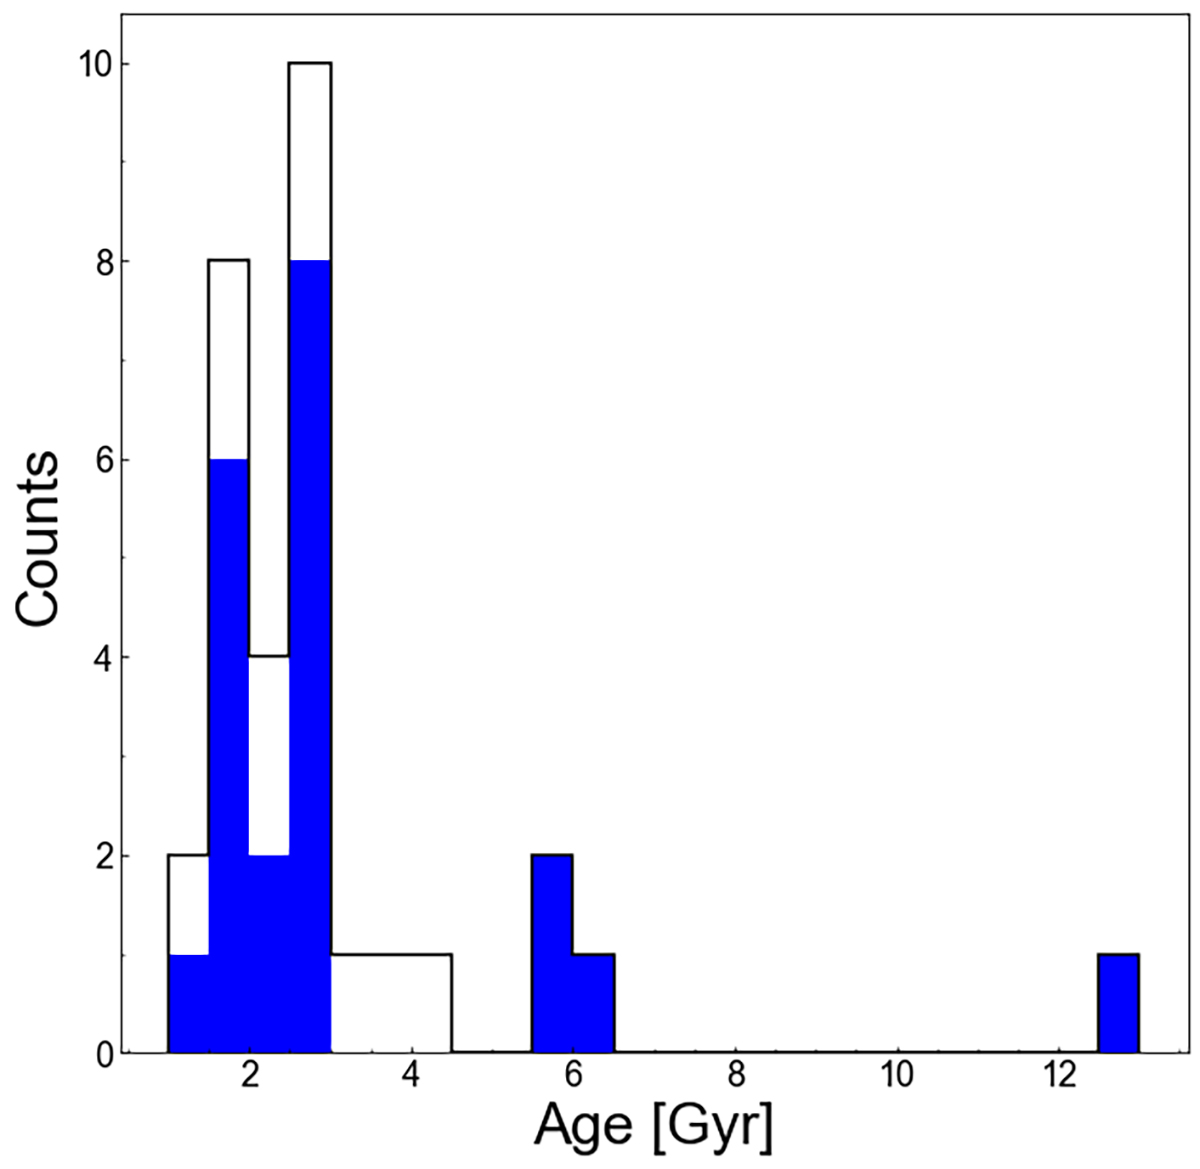
Age distribution of the 21 SCs identified in the LMC periphery, as examined in this work (depicted by the blue filled histogram). Additionally, we integrate data from 10 SCs previously analysed in Gatto et al. (2020) with G ≥ 5 (represented by the black histogram).
Current usage metrics show cumulative count of Article Views (full-text article views including HTML views, PDF and ePub downloads, according to the available data) and Abstracts Views on Vision4Press platform.
Data correspond to usage on the plateform after 2015. The current usage metrics is available 48-96 hours after online publication and is updated daily on week days.
Initial download of the metrics may take a while.