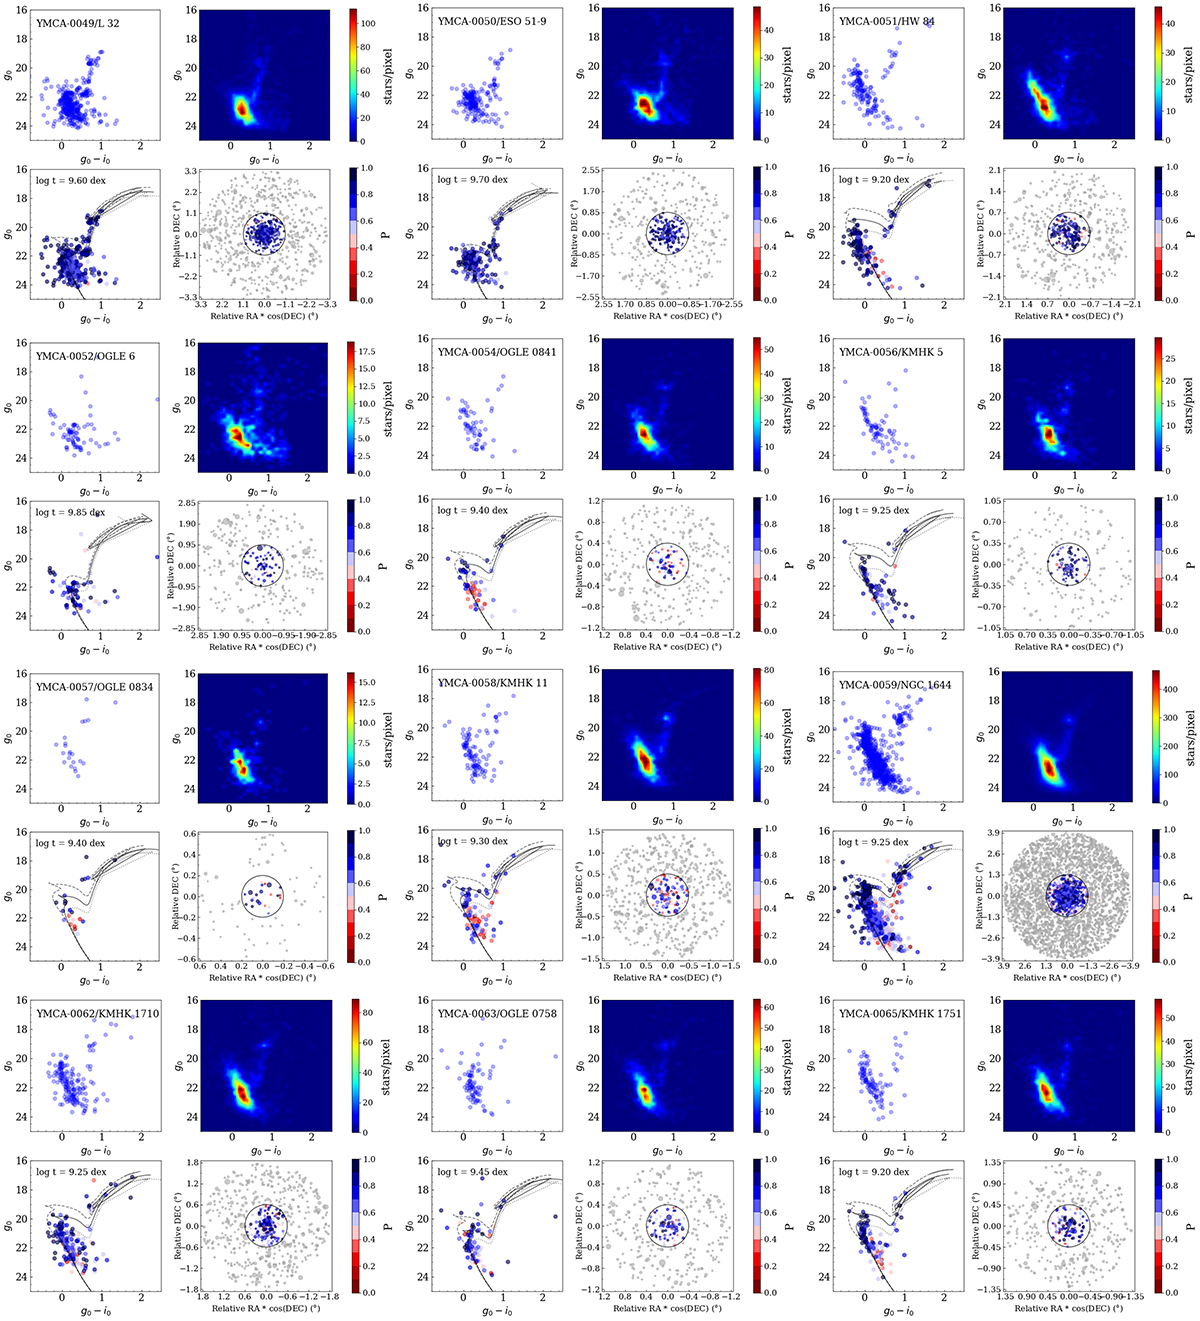
Fig. C.1.
Download original image
SCs already known analysed in this work. For each of them this figure illustrates: Top Left: CMD of the candidate SC; Top Right: Hess diagram of the six fields used as representative of the local stellar field contamination; Bottom Left: CMD of the SC with stars colour coded according to their membership probability of being a cluster member along with the best fitting isochrone (solid line) and isochrones at log(t) = ±0.2 dex from the best one; Bottom Right: Spatial distribution of stars with respect to the SC centre. The solid circle marks the estimated SC radius.
Current usage metrics show cumulative count of Article Views (full-text article views including HTML views, PDF and ePub downloads, according to the available data) and Abstracts Views on Vision4Press platform.
Data correspond to usage on the plateform after 2015. The current usage metrics is available 48-96 hours after online publication and is updated daily on week days.
Initial download of the metrics may take a while.