Fig. 4.
Download original image
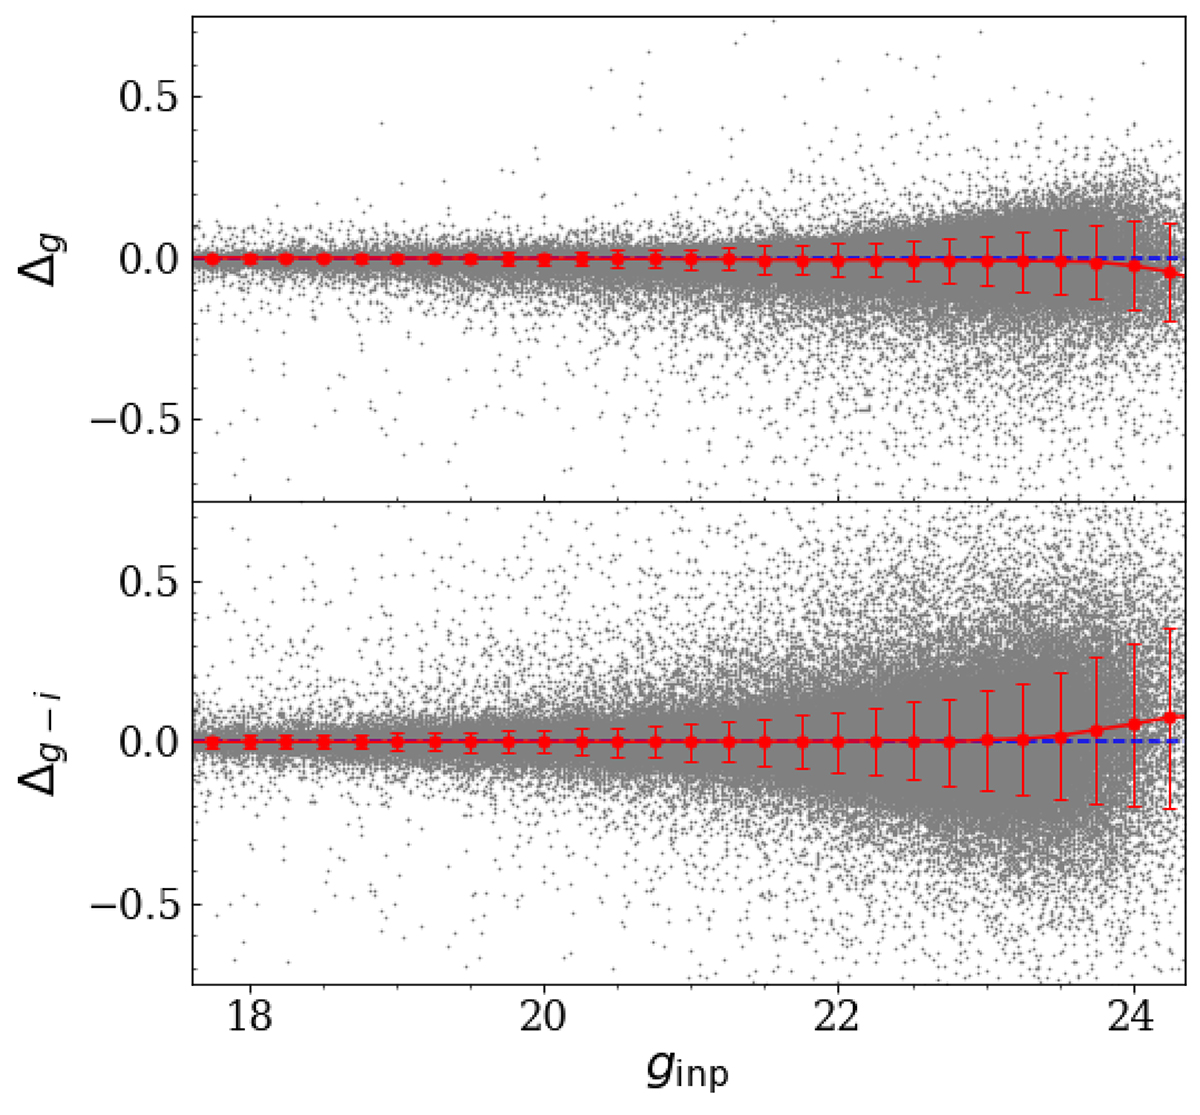
Magnitude difference (top) and colour difference (bottom), as a function of the input g-magnitude, between the injected and recovered artificial stars in the tile 7_26. We displayed only stars in the colour interval 0 ≤ ginp − iinp ≤ 1, which is typical for MC stars. Grey points show the position in these panels of each recovered artificial star, selected in the above-mentioned colour interval. Red dots and error bars indicate the mean magnitude/colour difference and their standard deviations in bins of ginp = 0.25 mag.
Current usage metrics show cumulative count of Article Views (full-text article views including HTML views, PDF and ePub downloads, according to the available data) and Abstracts Views on Vision4Press platform.
Data correspond to usage on the plateform after 2015. The current usage metrics is available 48-96 hours after online publication and is updated daily on week days.
Initial download of the metrics may take a while.