Fig. 9.
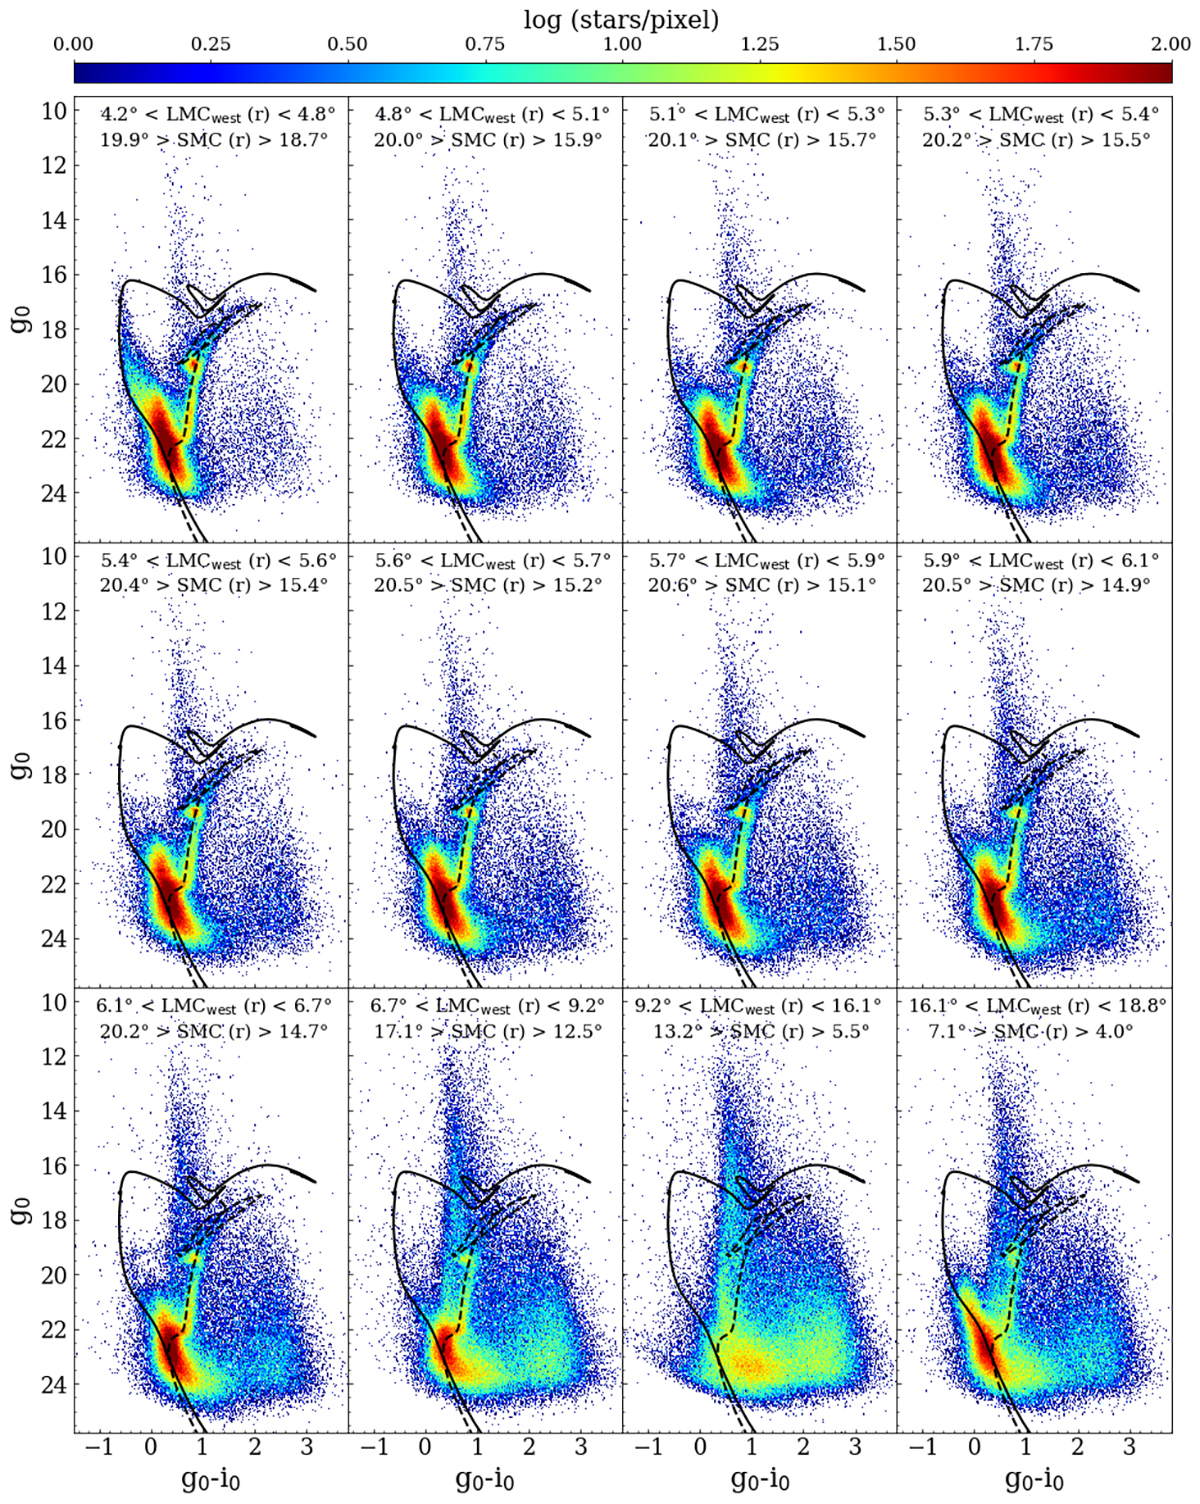
Download original image
Hess diagrams of the tiles located between the west side of the LMC and the east side of the SMC. They are ordered based on their distance from the LMC centre. Each subpanel shows about 130 000 stars. The isochrones are representative of a young (t = 200 Myr; Z = 0.008 dex, solid line) and old (t ∼ 12.5 Gyr, Z = 0.001 dex, dashed line) stellar population, corrected for the distance modulus of the LMC. At the top of each subplot the range of angular distances from the LMC and SMC centres are indicated.
Current usage metrics show cumulative count of Article Views (full-text article views including HTML views, PDF and ePub downloads, according to the available data) and Abstracts Views on Vision4Press platform.
Data correspond to usage on the plateform after 2015. The current usage metrics is available 48-96 hours after online publication and is updated daily on week days.
Initial download of the metrics may take a while.