Fig. 12
Download original image
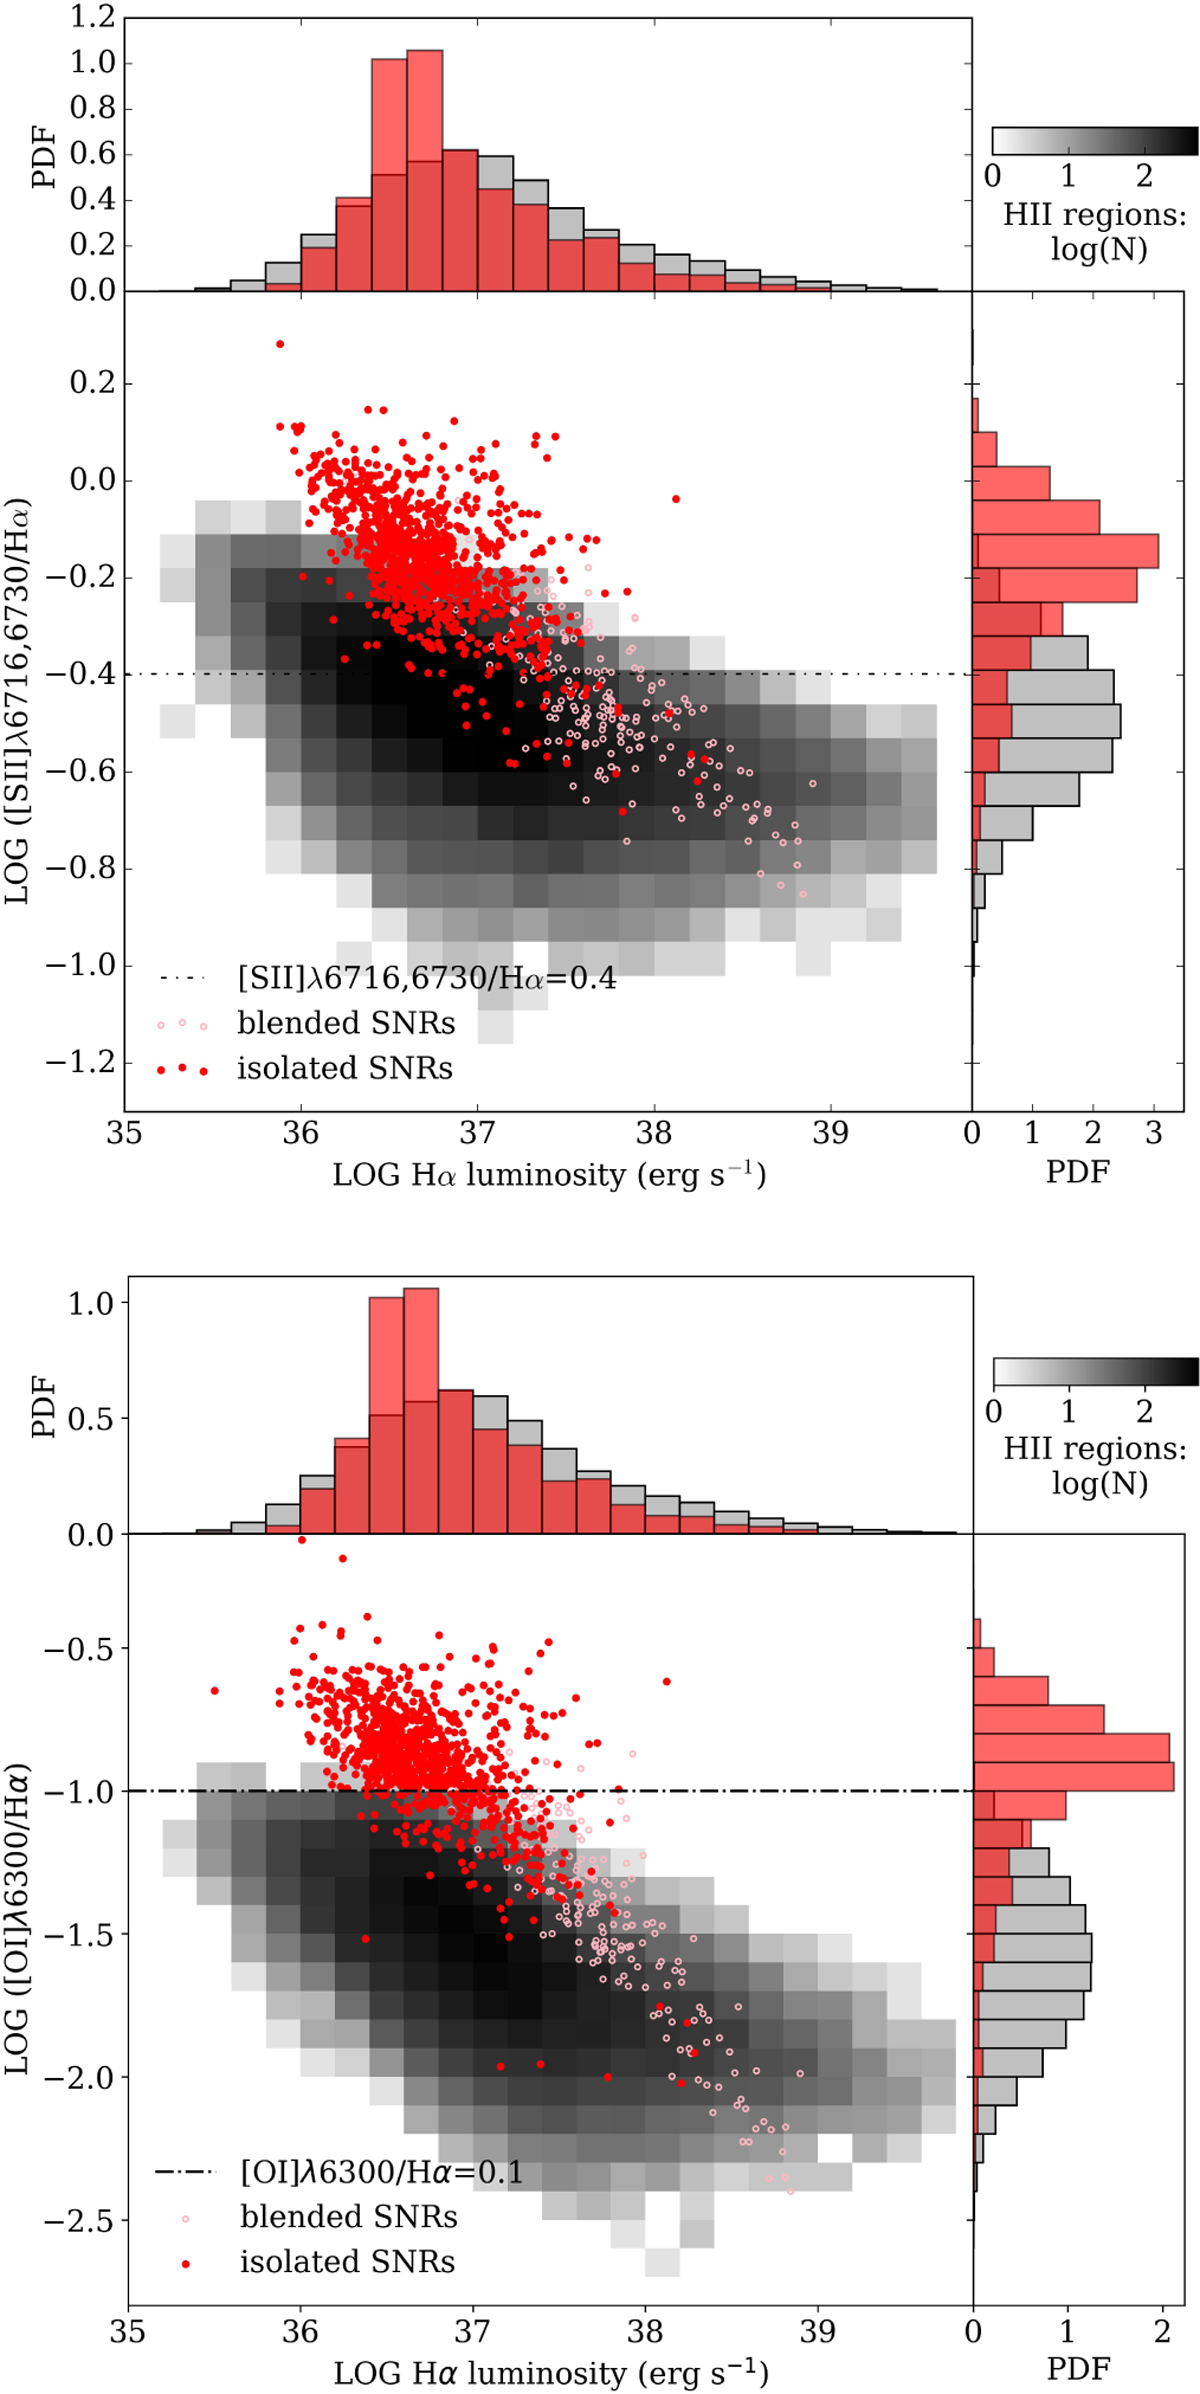
[S II]/Hα (top) and [O I]/Hα (bottom) versus Hα luminosity for SNRs (red dots) compared with the H II regions density distribution (in grayscale). For SNRs that overlap with a H II region, the symbol is an empty circle (in light red). Thresholds of [O I]/Hα=0.1 and [S II]/Hα=0.4 (horizontal dash-dotted lines) are shown. SNRs overlapping with H II regions are selected by other criteria so they can still be identified as SNRs. Emission lines are not corrected for the photoionization.
Current usage metrics show cumulative count of Article Views (full-text article views including HTML views, PDF and ePub downloads, according to the available data) and Abstracts Views on Vision4Press platform.
Data correspond to usage on the plateform after 2015. The current usage metrics is available 48-96 hours after online publication and is updated daily on week days.
Initial download of the metrics may take a while.