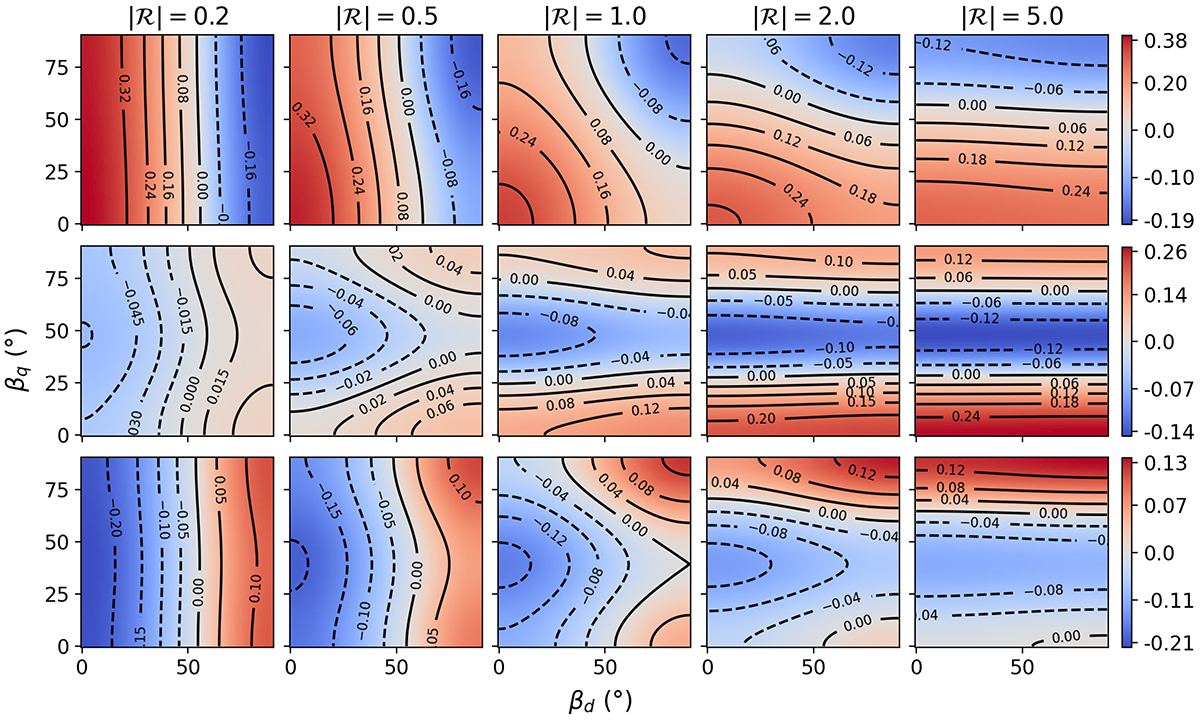
Fig. 4.
Download original image
Color maps for each theoretical asymmetry parameter (top: a11, middle: a21, bottom: a22) for different values of ℛ. The solid (dashed) overplotted contours emphasize the values of the asymmetry parameters. Only the positive values of ℛ are shown since aℓ|m| are functions of ℛ2. There are symmetry relations of aℓ|m|(ℛ, 90° −βd, βq) = aℓ|m|(ℛ, 90° +βd, βq),aℓ|m|(ℛ, βd, 90° −βq) = aℓ|m|(ℛ, βd, 90° +βq) intrinsic to Eqs. (28)–(30); therefore, we limited βd and βq to the interval [0° ,90° ]. From left to right, the figure shows how the theoretical aℓ|m| vary with increasing |ℛ|.
Current usage metrics show cumulative count of Article Views (full-text article views including HTML views, PDF and ePub downloads, according to the available data) and Abstracts Views on Vision4Press platform.
Data correspond to usage on the plateform after 2015. The current usage metrics is available 48-96 hours after online publication and is updated daily on week days.
Initial download of the metrics may take a while.