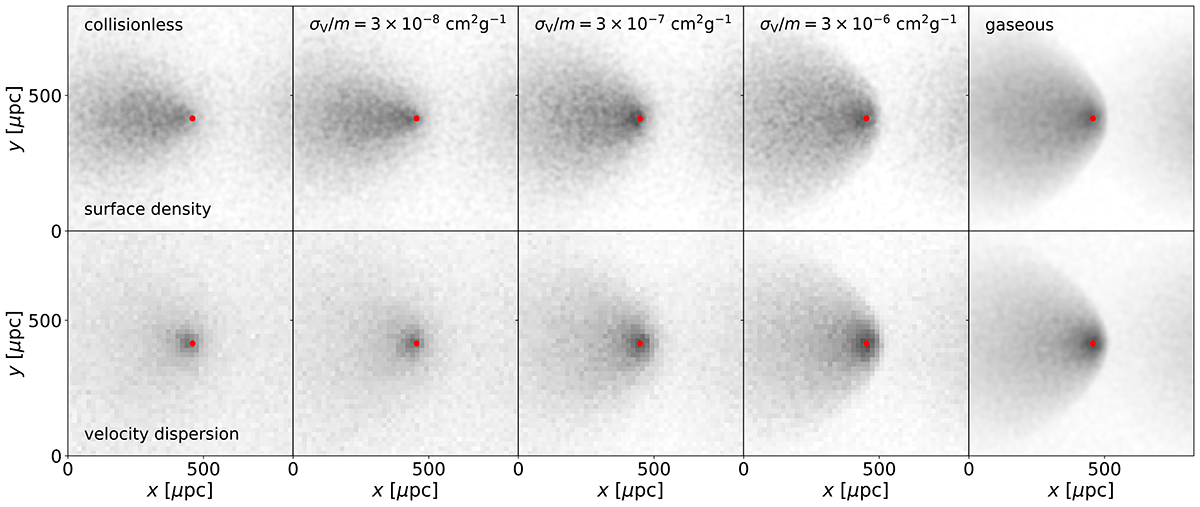
Fig. 6.
Download original image
Surface density (top row) and the velocity dispersion (bottom row) for our test simulations at a time of t = 0.49 yr. The panels display the different types of matter we investigate, with increasing collisionality from the left to the right. The density and one dimensional velocity dispersion are indicated following a logarithmic colour scale spanning a factor of two. For all panels of the same quantity, the same colour scale is used. In addition, we indicate the position of the BH particle with a red dot. We provide the time evolution of the surface density as a video available online.
Current usage metrics show cumulative count of Article Views (full-text article views including HTML views, PDF and ePub downloads, according to the available data) and Abstracts Views on Vision4Press platform.
Data correspond to usage on the plateform after 2015. The current usage metrics is available 48-96 hours after online publication and is updated daily on week days.
Initial download of the metrics may take a while.