Fig. 5
Download original image
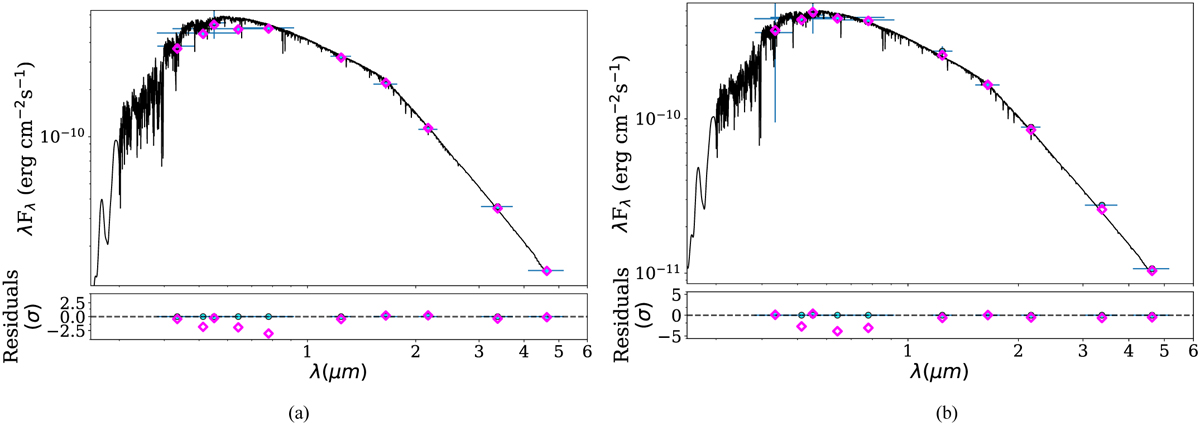
SED for TOI-2420 (left) and TOI-2485 (right) and the best-fit models from (Phoenix v2, Husser et al. 2013). The magenta and blue diamonds show the synthetic and the observed photometry, respectively. The 1σ uncertainties of the magnitudes are marked with vertical bars, and the horizontal bars show the effective width of the respective passband. The lower panels show the residuals normalized to the photometry errors.
Current usage metrics show cumulative count of Article Views (full-text article views including HTML views, PDF and ePub downloads, according to the available data) and Abstracts Views on Vision4Press platform.
Data correspond to usage on the plateform after 2015. The current usage metrics is available 48-96 hours after online publication and is updated daily on week days.
Initial download of the metrics may take a while.