Fig. 7
Download original image
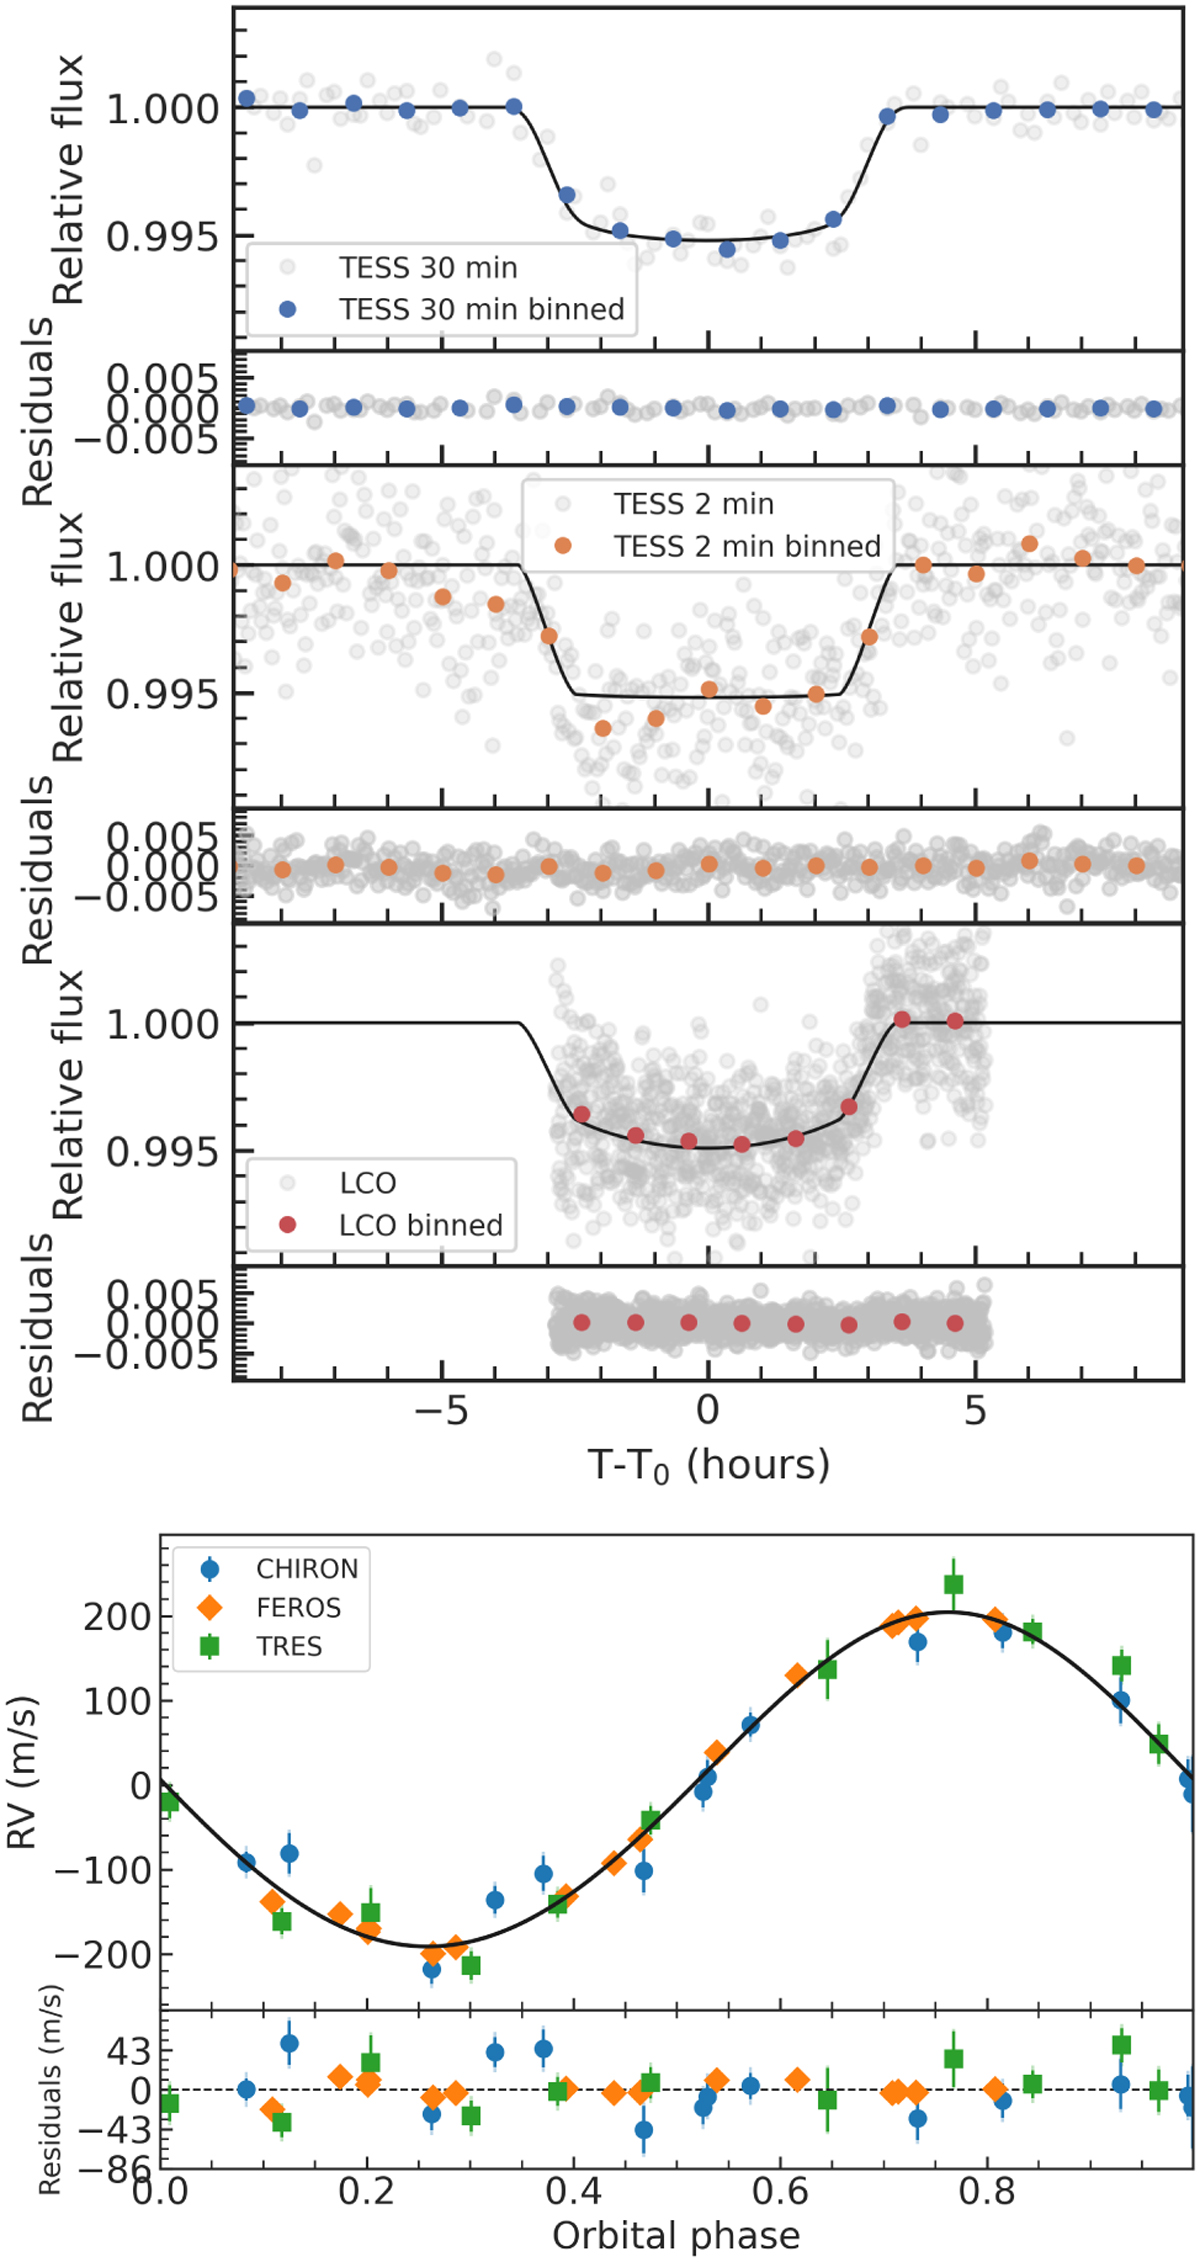
Resulting fit from the TOI-2485 b joint model. Top panel: phase-folded transit light curve TOI-2485 b. Nominal TESS and LCO observations are shown in light gray. The solid coloured circles represent the binned data. The transit models are shown with a solid black line. Bottom panel: phase-folded RV signal for TOI-2485 b following the subtraction of the systemic velocities. The orange circles, diamonds, and squares show CHIRON, FEROS, and TRES RV data, respectively.
Current usage metrics show cumulative count of Article Views (full-text article views including HTML views, PDF and ePub downloads, according to the available data) and Abstracts Views on Vision4Press platform.
Data correspond to usage on the plateform after 2015. The current usage metrics is available 48-96 hours after online publication and is updated daily on week days.
Initial download of the metrics may take a while.