Fig. 9
Download original image
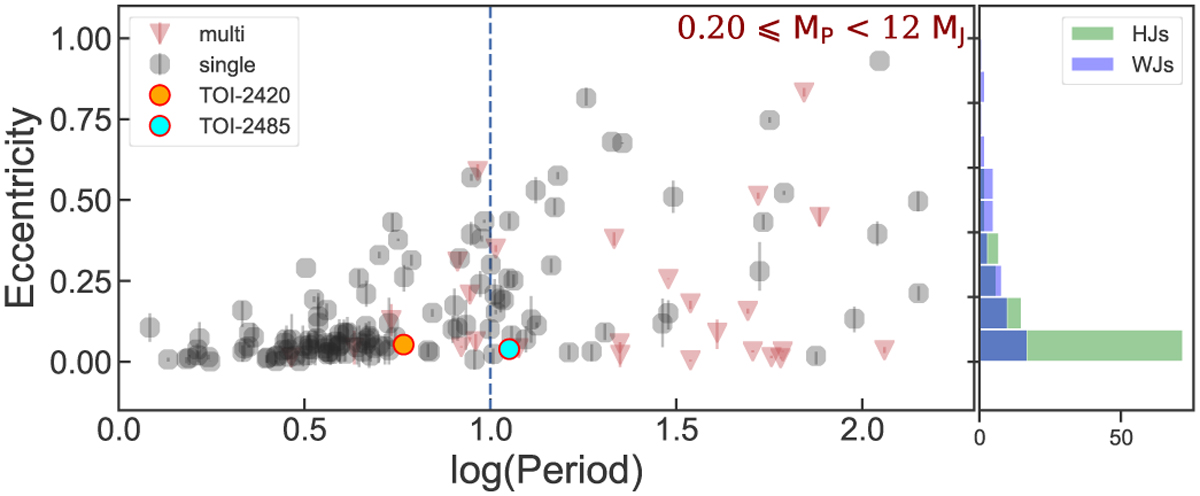
Eccentricity distribution as a function of the orbital period for Jupiter-sized planets (data taken as of UT 2024 March 13). The dashed blue line represents the 10-day boundary between HJs and WJs. The orange point represents TOI-2420 b, and the cyan point represents TOI-2485 b. The red triangles represent the planets in multiplanet systems.
Current usage metrics show cumulative count of Article Views (full-text article views including HTML views, PDF and ePub downloads, according to the available data) and Abstracts Views on Vision4Press platform.
Data correspond to usage on the plateform after 2015. The current usage metrics is available 48-96 hours after online publication and is updated daily on week days.
Initial download of the metrics may take a while.