Open Access
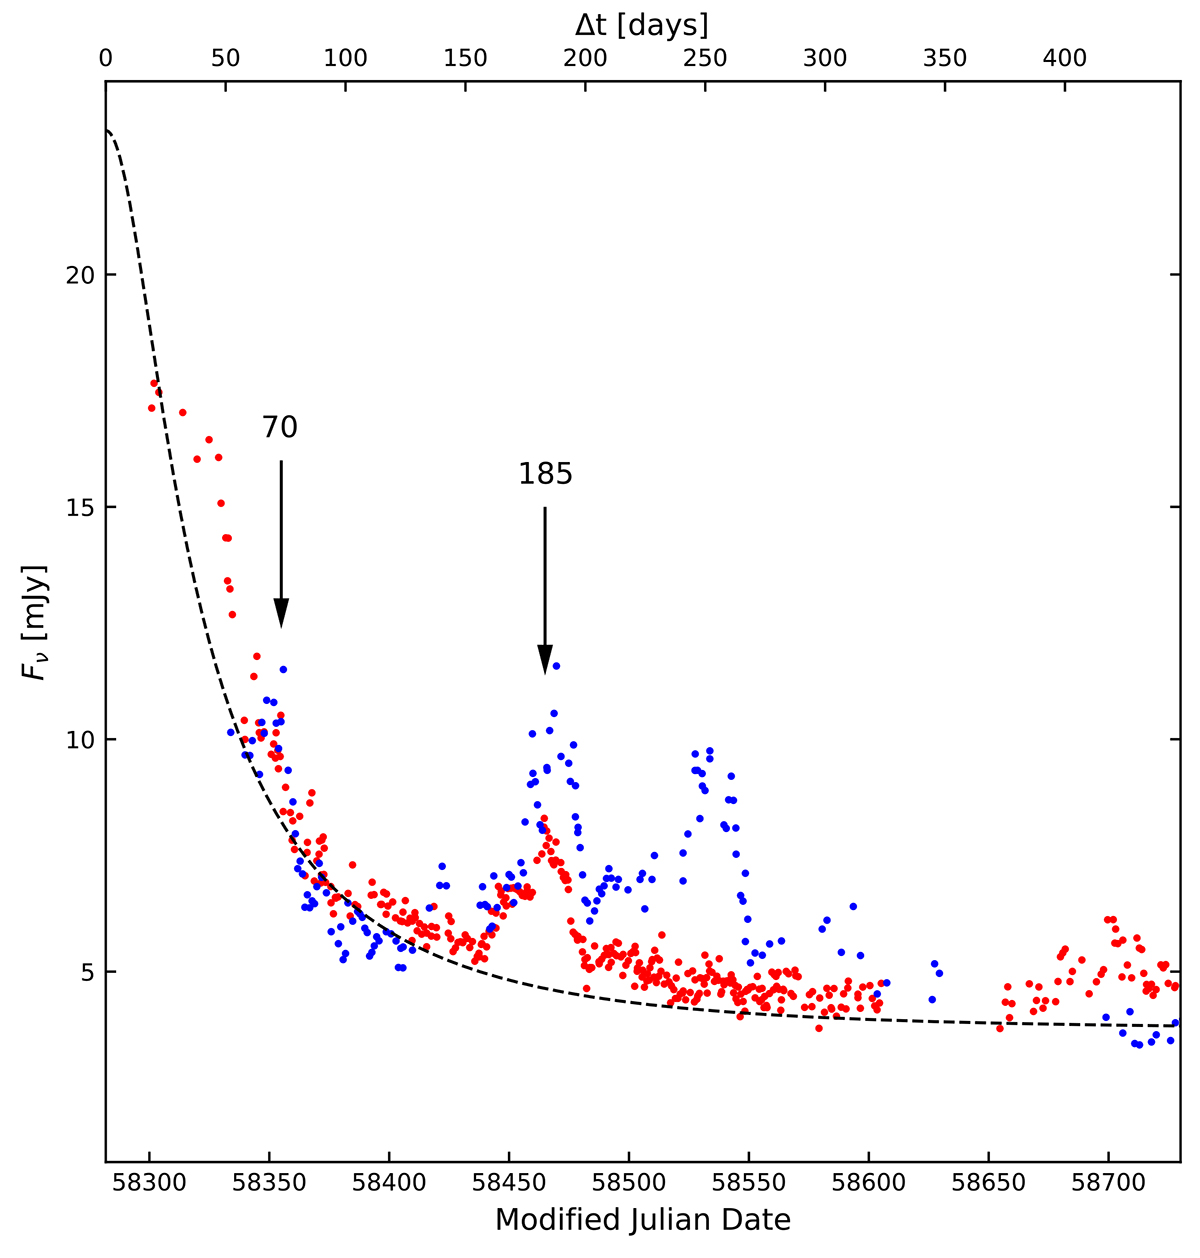
Fig. 3.
Download original image
Original and flipped light curve for 2018 June 12 (blue: before outburst; red: after outburst). This zoom in of Fig. 2 highlights the outbursts at ±70 days and ±185 days before and after the adopted maximum at MJD 58282.
Current usage metrics show cumulative count of Article Views (full-text article views including HTML views, PDF and ePub downloads, according to the available data) and Abstracts Views on Vision4Press platform.
Data correspond to usage on the plateform after 2015. The current usage metrics is available 48-96 hours after online publication and is updated daily on week days.
Initial download of the metrics may take a while.