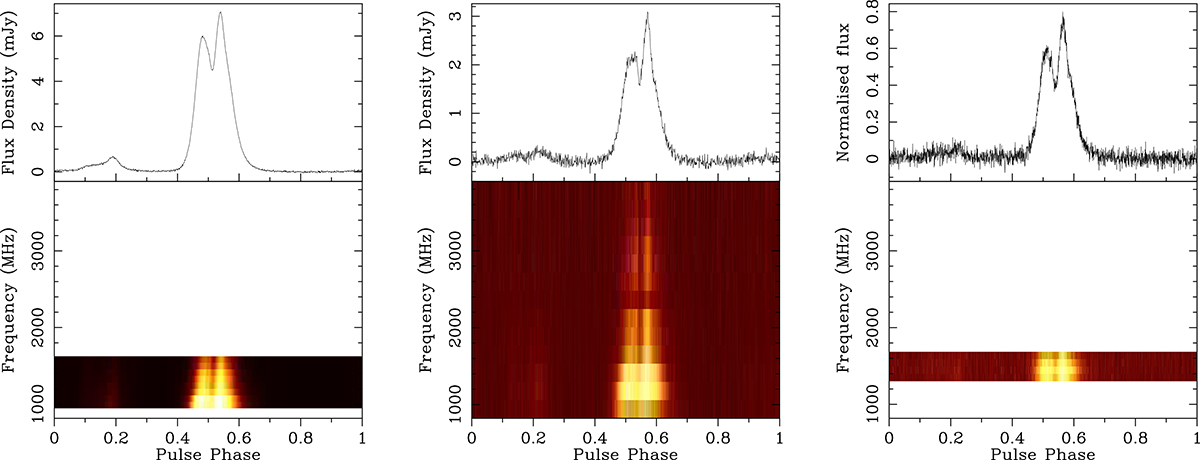
Fig. 1.
Download original image
Frequency resolved intensity profiles from observations with the MeerKAT L-band receiver (left, Tobs ∼ 28.85 h), the Parkes UWL receiver (middle, Tobs ∼ 28.95 h) and the NRT L-band receiver (right, Tobs ∼ 48.9 h). The top panel of each plot shows the total intensity profile across one period, in case of the MeerKAT and Parkes observations it is flux calibrated. The NRT observations are not flux-calibrated. The bottom panels show the frequency resolved dynamic spectra across adjacent frequency bands. The intensity scale of the MeerKAT and NRT dynamic spectra were adjusted to fit the range of the Parkes spectrum for ease of comparison. The MeerKAT observations were frequency scrunched to 8 channels, those from Parkes down to 13 channels and the NRT data was decimated to 4 channels. The number of channels was chosen such that the frequency resolution is kept as large as possible while providing a S/N in each band that allows for a sufficient ToA precision.
Current usage metrics show cumulative count of Article Views (full-text article views including HTML views, PDF and ePub downloads, according to the available data) and Abstracts Views on Vision4Press platform.
Data correspond to usage on the plateform after 2015. The current usage metrics is available 48-96 hours after online publication and is updated daily on week days.
Initial download of the metrics may take a while.