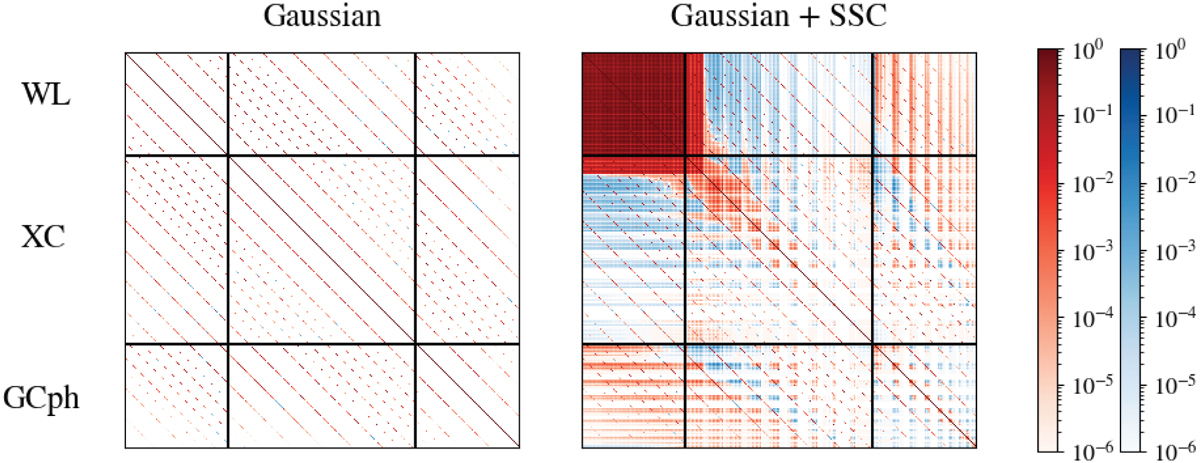
Fig. 3

Download original image
Correlation matrix in log scale for all the statistics of the 3×2pt data-vector in the G and GS cases. The positive and negative elements are shown in red and blue, respectively. The Gaussian covariance is block diagonal (i.e. it is diagonal in the multipole indices, but not in the redshift ones; the different diagonals appearing in the plot correspond to the different redshift pair indices, for ℓ1 = ℓ2). The overlap in the WL kernels makes the WL block in the Gaussian + SSC covariance matrix much more dense than the GCph one.
Current usage metrics show cumulative count of Article Views (full-text article views including HTML views, PDF and ePub downloads, according to the available data) and Abstracts Views on Vision4Press platform.
Data correspond to usage on the plateform after 2015. The current usage metrics is available 48-96 hours after online publication and is updated daily on week days.
Initial download of the metrics may take a while.


