Open Access
Fig. A.3.
Download original image
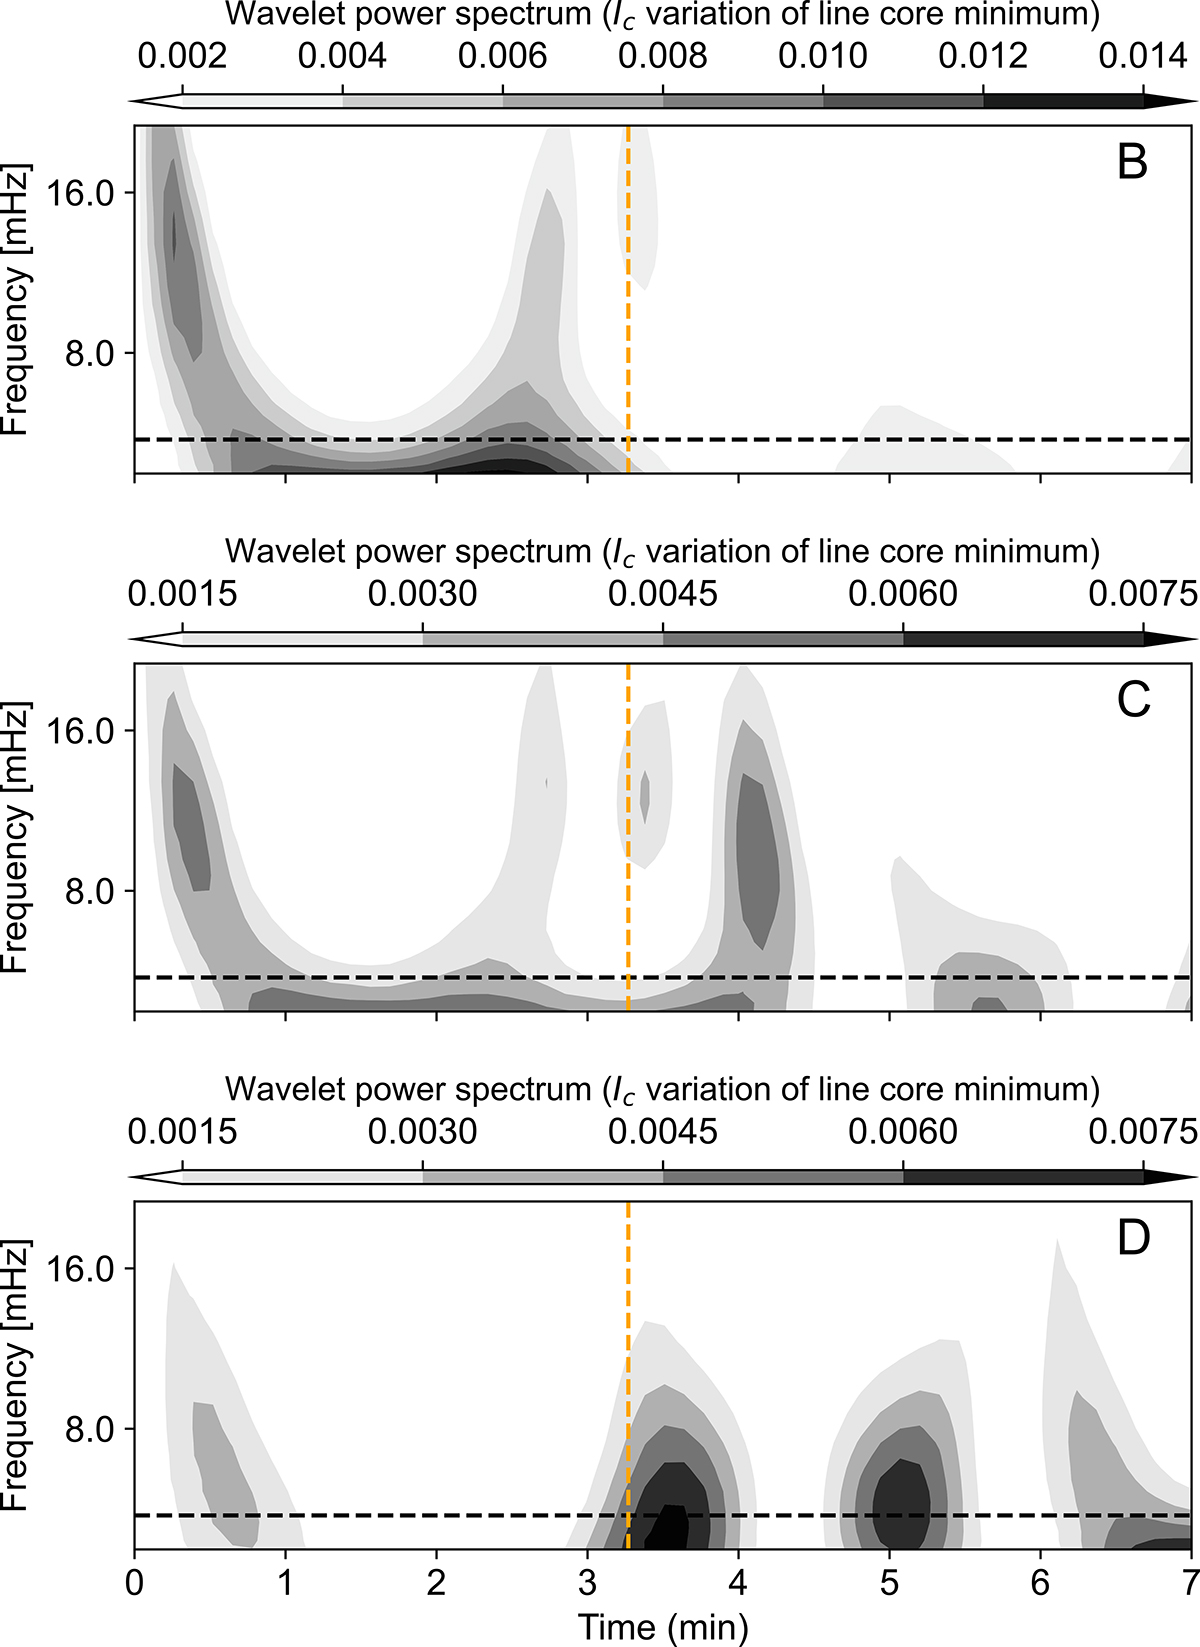
Wavelet power-spectra of the three pixels marked by a red, magenta and cyan plus signs (+) in the zoomed inset in the top right map of Fig. A.1 and labelled as B, C, and D respectively. The horizontal black dashed line marks 5.5 mHz and the vertical orange dashed line refers to the time t = 3.27 min.
Current usage metrics show cumulative count of Article Views (full-text article views including HTML views, PDF and ePub downloads, according to the available data) and Abstracts Views on Vision4Press platform.
Data correspond to usage on the plateform after 2015. The current usage metrics is available 48-96 hours after online publication and is updated daily on week days.
Initial download of the metrics may take a while.