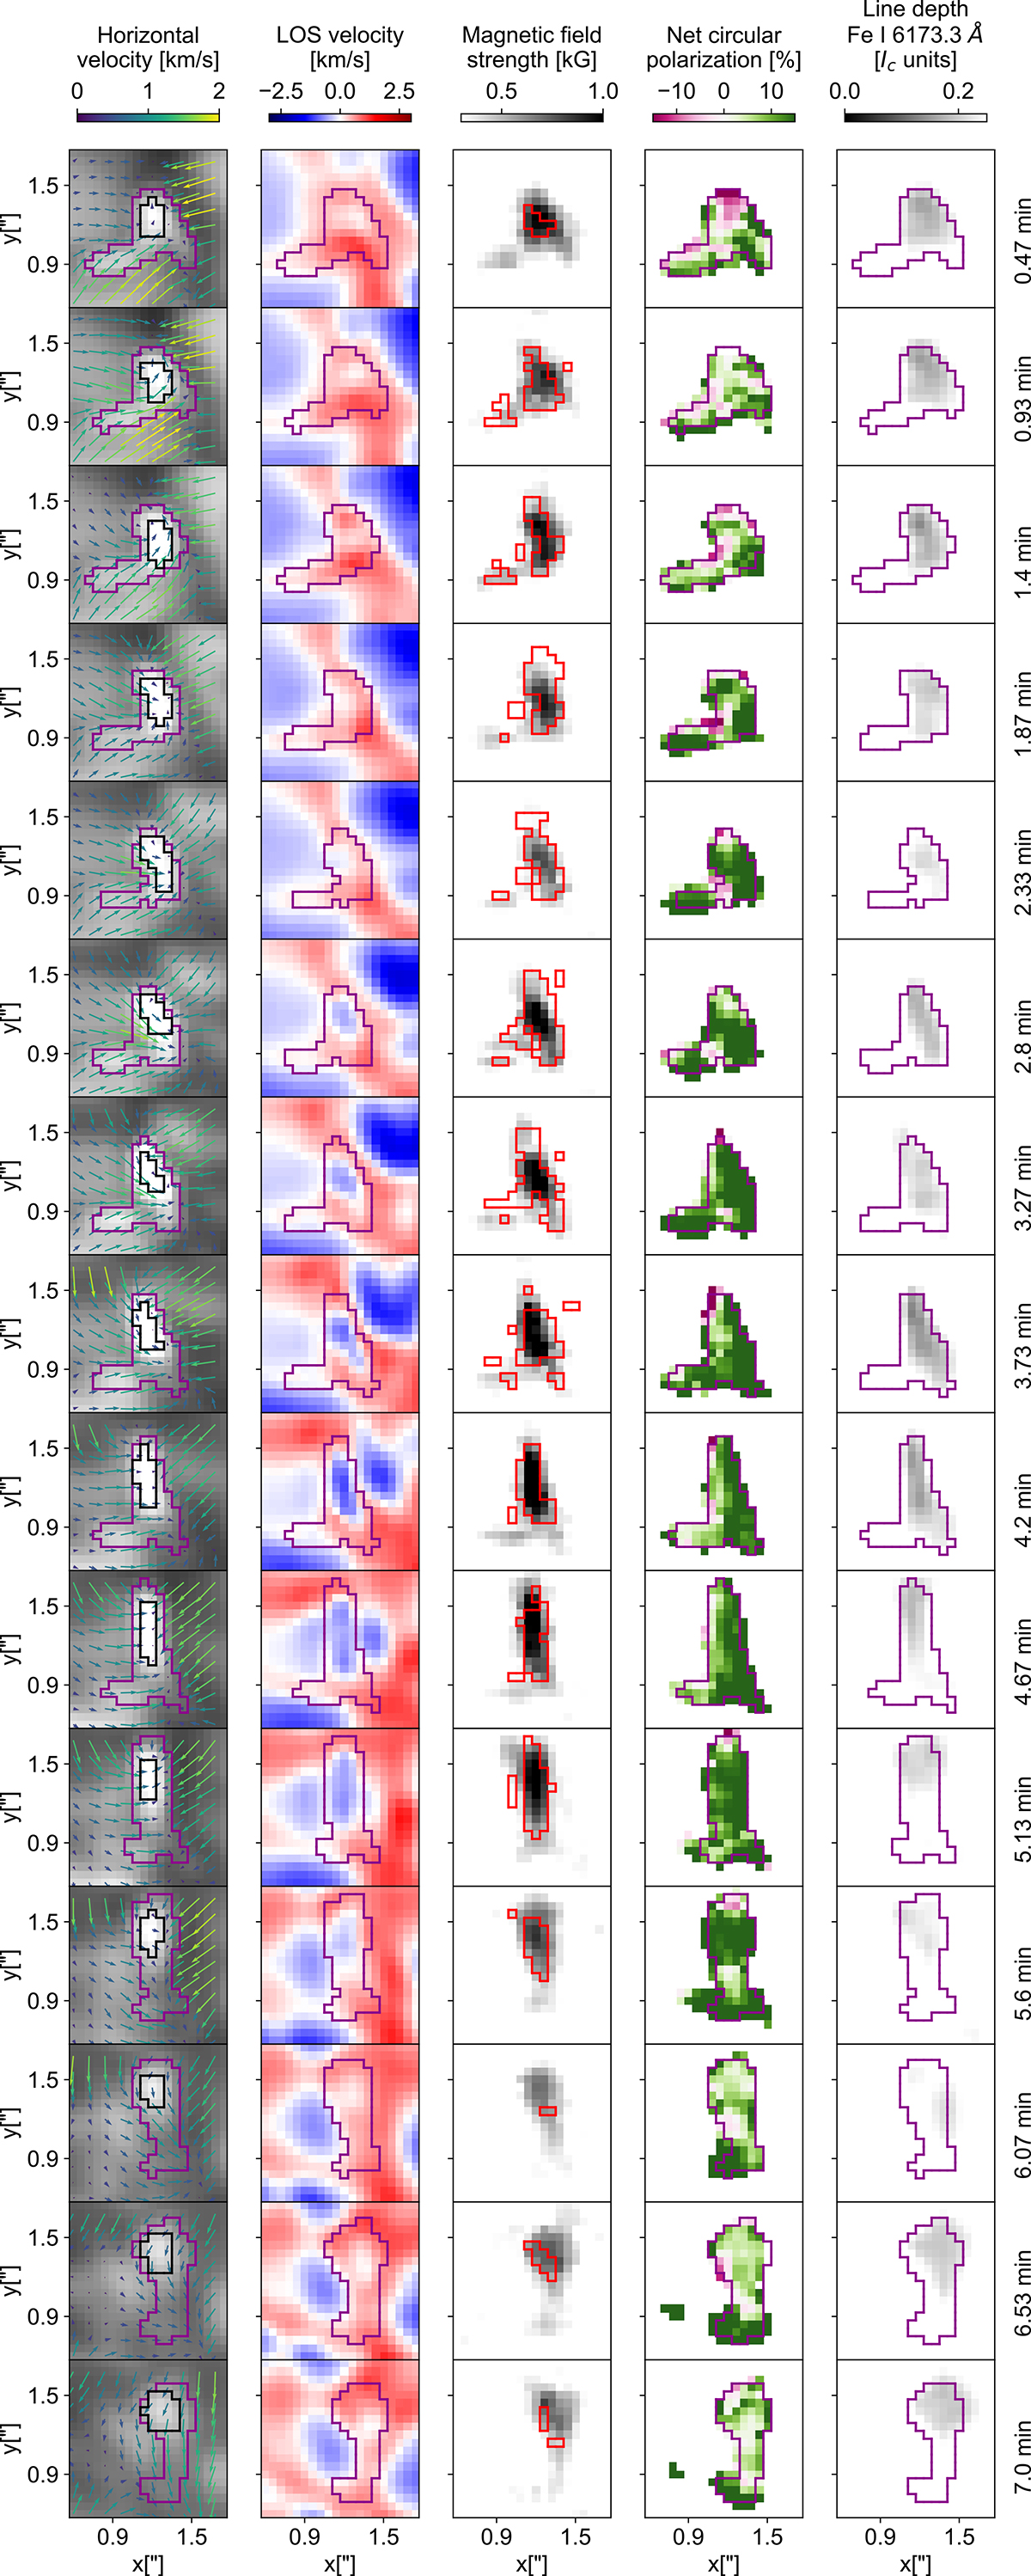
Fig. 2.
Download original image
Evolution (top to bottom) of the studied magnetic flux concentration in the photosphere (see the time stamp in the right margin). First column: Continuum intensity including the horizontal component of the velocity field, where each arrow represents 3 × 3 pixels. The length and the colour of the arrows are proportional to the magnitude of the velocity. The purple contour highlights the full area of the MBP. The black contour refers to the area of the MBP core. Second and third column: LOS velocity and magnetic field strength from the VFISV inversion. Red contours in the third column correspond to TLP above 1.5σp. Fourth column: NCP percentage. Fifth column: Line depth of the Fe I line in units of the continuum intensity.
Current usage metrics show cumulative count of Article Views (full-text article views including HTML views, PDF and ePub downloads, according to the available data) and Abstracts Views on Vision4Press platform.
Data correspond to usage on the plateform after 2015. The current usage metrics is available 48-96 hours after online publication and is updated daily on week days.
Initial download of the metrics may take a while.