Fig. 5.
Download original image
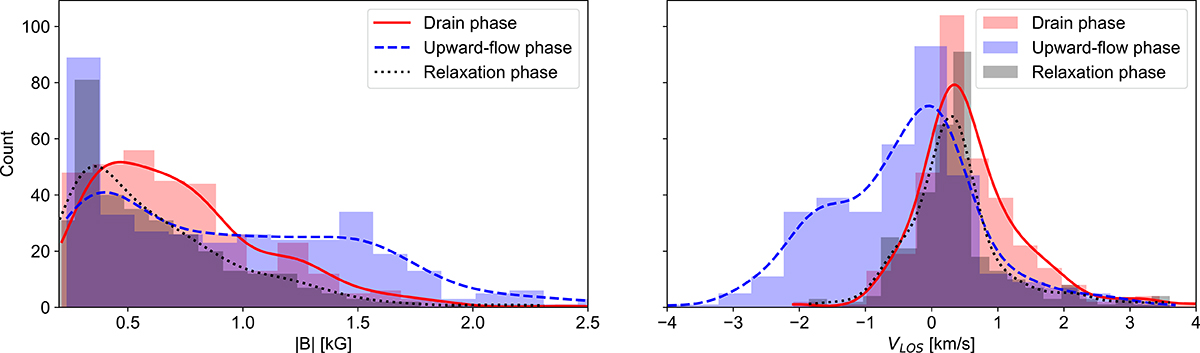
Probability density function (histogram and its respective curve) for the magnetic field strength (left plots) and LOS velocity (right plots) over the area of the magnetic flux concentration (region marked by the purple contour in the first column of Fig. 2) for the three defined evolution phases: the drain phase (between t = 0.0 min to t = 2.3 min), the upward-flow phase (between t = 2.8 min to t = 5.13 min), and the relaxation phase (between t = 5.6 min to t = 7.0 min). The information included in the labels applies to both panels.
Current usage metrics show cumulative count of Article Views (full-text article views including HTML views, PDF and ePub downloads, according to the available data) and Abstracts Views on Vision4Press platform.
Data correspond to usage on the plateform after 2015. The current usage metrics is available 48-96 hours after online publication and is updated daily on week days.
Initial download of the metrics may take a while.