Fig. 4
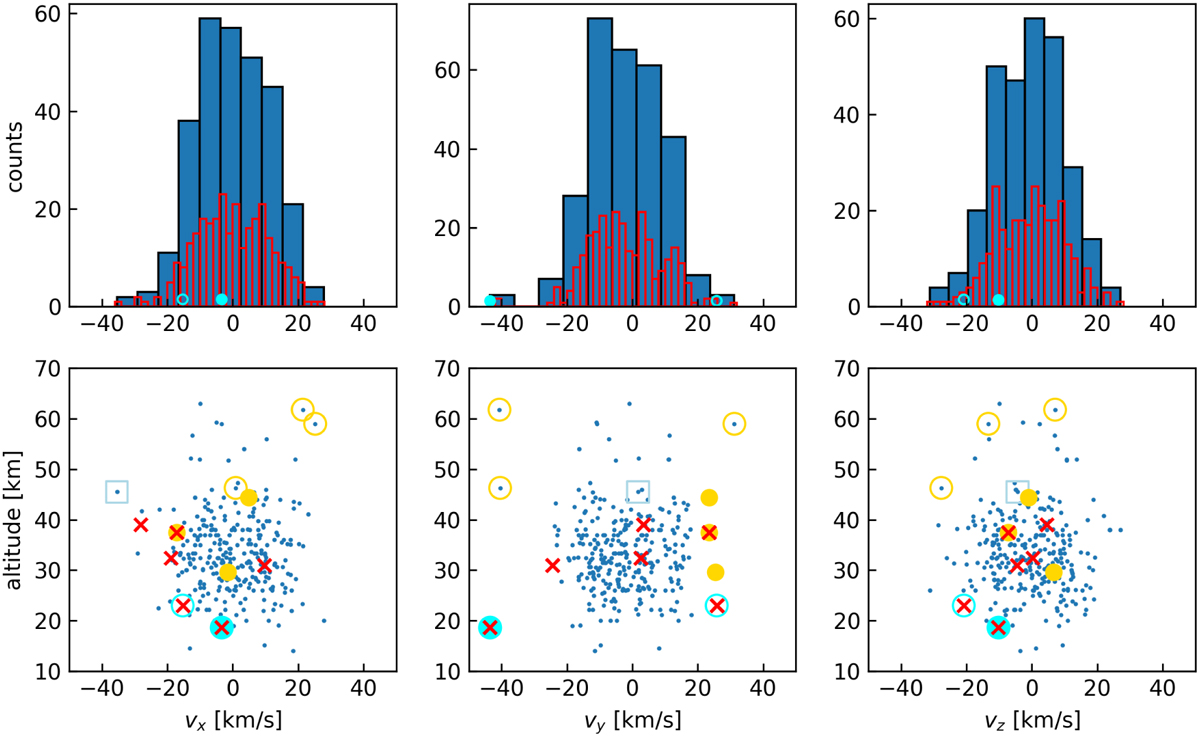
Download original image
Deviations in the velocity components. Upper panels: histograms of each of the velocity components for all CNEOS events. The red histograms assume a bin width of 2 km s−1. Lower panels: altitude-velocity plots for each of the velocity components. For easier identification of individual events in the histograms, the x-scales for the top and bottom panels are aligned. The symbols are consistent with those in Fig. 3.
Current usage metrics show cumulative count of Article Views (full-text article views including HTML views, PDF and ePub downloads, according to the available data) and Abstracts Views on Vision4Press platform.
Data correspond to usage on the plateform after 2015. The current usage metrics is available 48-96 hours after online publication and is updated daily on week days.
Initial download of the metrics may take a while.